CARDIOVASCULAR JOURNAL OF AFRICA • Vol 23, No 1, February 2012
20
AFRICA
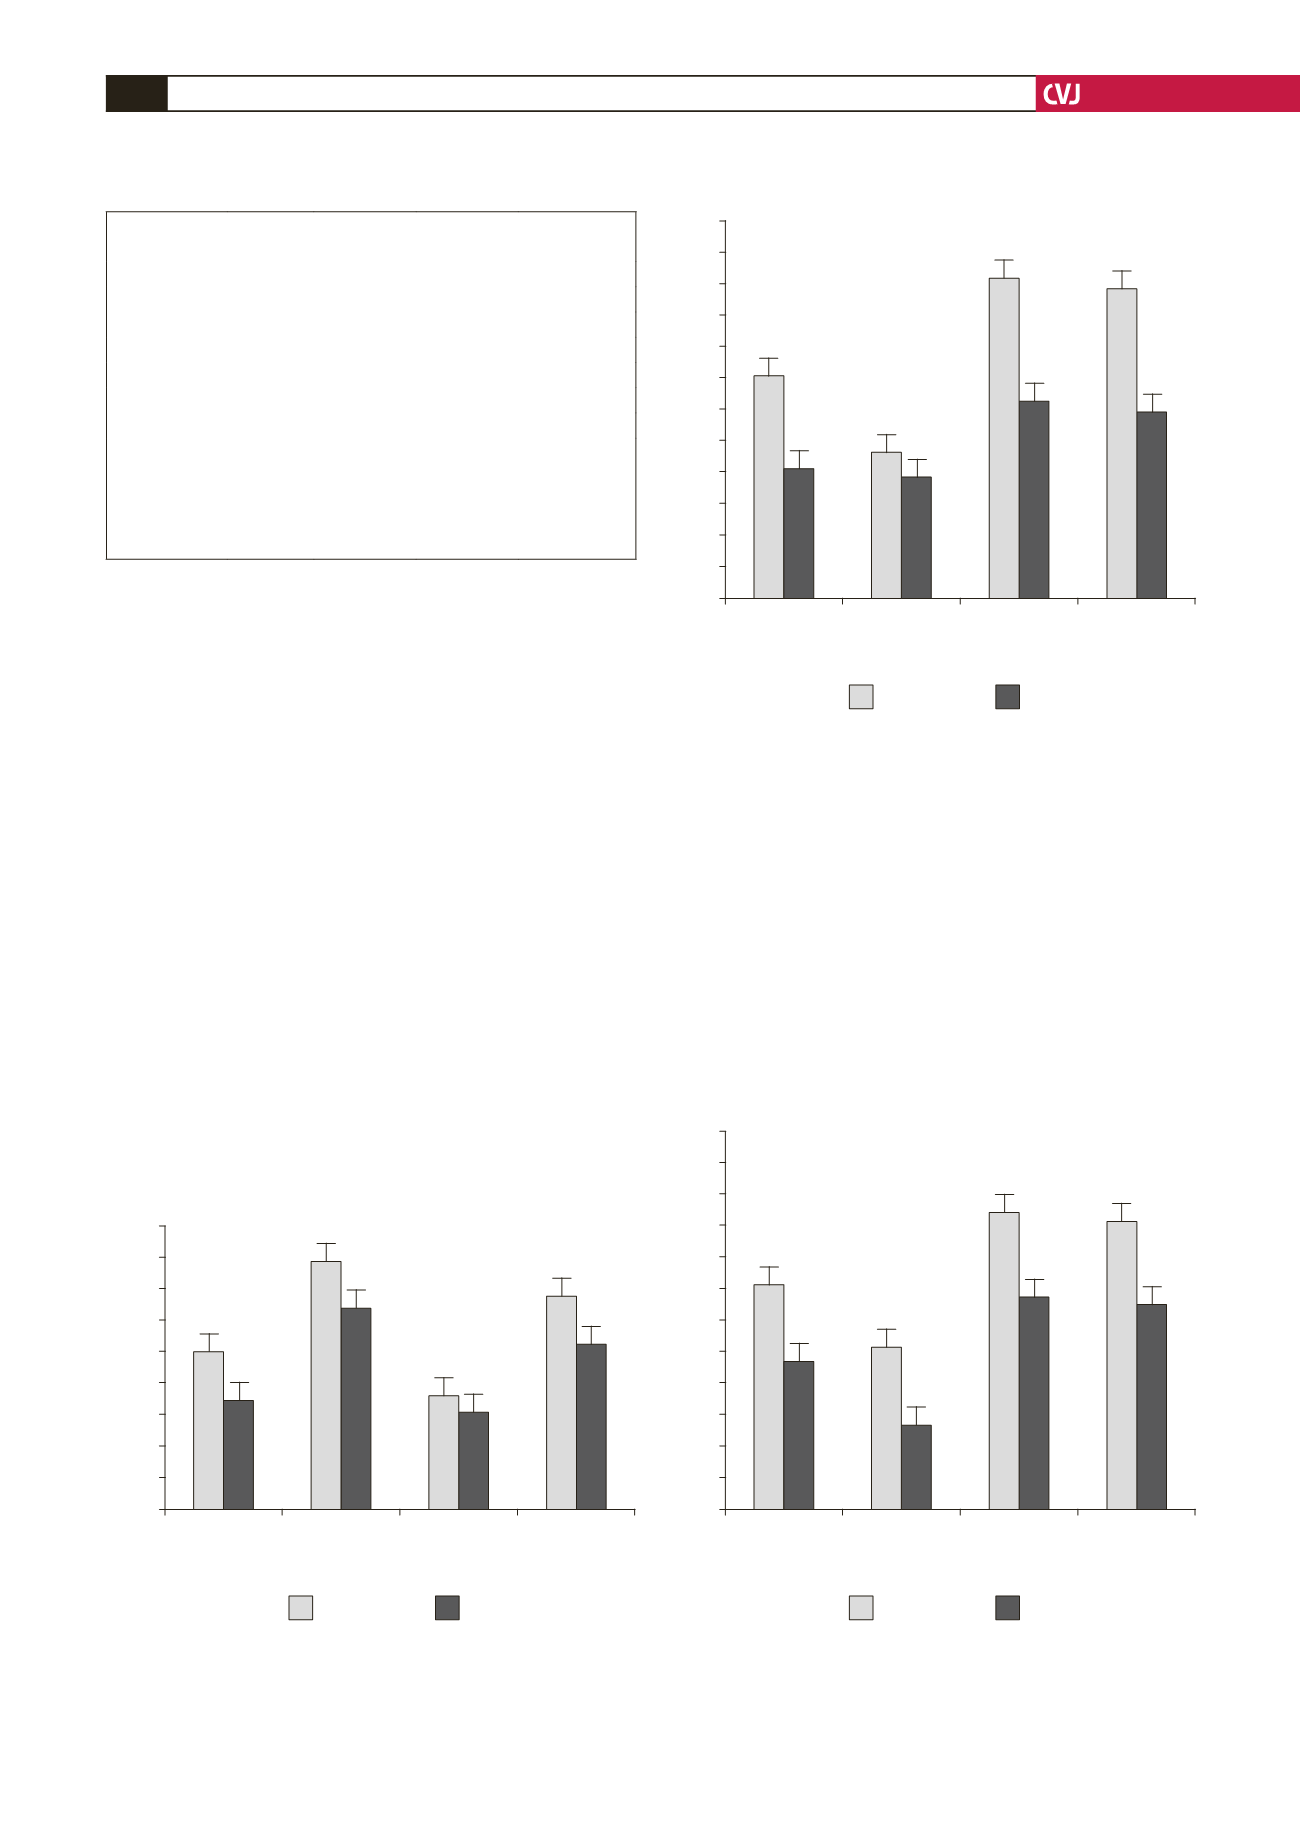
plus amlodipine (group 4), compared with the controls (
p
<
0.05). Moreover, the activity of mitochondrial SOD (mtSOD)
in the heart samples was enhanced in the rabbits on a regular
diet plus amlodipine (group 3) and those on 2% cholesterol plus
amlodipine (group 4), compared to the controls (group 1) and the
2% cholesterol group (group 2) (
p
<
0.05).
The changes in GPX activity (Fig. 3) in the heart samples
were similar to the changes in SOD activity, except for the
rabbits on the 2% cholesterol diet (group 2), whose GPX activity
decreased compared to the control group (
p
<
0.05).
Discussion
Our results indicate that eight weeks of a 2% high-cholesterol
diet increased all serum cholesterol profile fractions and induced
oxidative stress in the blood and heart tissue, since the level of
TBARs (a marker of lipid peroxidation) significantly increased
in all cholesterol-fed rabbits. The key finding of this study was
that eight weeks of amlodipine treatment reduced oxidative
stress in the blood and hearts of cholesterol-fed rabbits.
As an index of the anti-oxidative defence system, we meas-
ured the activities of SOD and GPX and the levels of MDA. A
considerable number of studies have accumulated to suggest that
most CCBs may be effective in preventing the development of
atherosclerosis. The most important mechanisms involved may
include antioxidant effects, and changes in Ca
2+
and cholesterol
metabolism.
19-21
In this study, chronic amlodipine treatment increased HDL-C
levels or the ratio of HDL-C to LDL-C, and reduced LDL-C and
TG levels in the plasma. The importance of LDL-C, HDL-C and
TC is well documented in the pathogenesis of atherosclerosis,
but TG levels should not be ignored.
22
In addition to the pivotal
role that HDL-C plays in reverse cholesterol transport and cellu-
lar cholesterol efflux, it possesses a spectrum of anti-inflamma-
TABLE 1. COMPARISON OF THE SERUM LIPID
PROFILE CHANGES (MG/DL)
Variable
Group 1 Group 2
Group 3
Group 4
Total cholesterol 49.13
±
0.6 860.3
±
0.6*
40.3
±
0.8
524.5
±
5.8*
#
LDL
7.23
±
1.39 722
±
0.86* 13.13
±
0.20 451.43
±
6.70*
#
HDL
14
±
0.73
49
±
0.63* 19.83
±
0.54* 48.33
±
0.95*
TG
95.50
±
1.7 466.6
±
2.5*
81
±
0.50*
138.6
±
1.8*
#
HDL:LDL
2.47
±
0.60 0.07
±
0.001* 1.50
±
0.05
0.11
±
0.002*
HDL:TC
0.35
±
0.02 0.06
±
0.001* 0.4
±
0.007* 0.09
±
0.001*
Rabbits were fed a regular diet (group 1), 2% cholesterol diet (group 2), regular
diet plus amlodipine 5 mg/kg/day (group 3) and a 2% cholesterol-plus-amlo-
dipine diet (group 4).
Data are expressed as mean
±
SEM for each group (
n
=
9).
Differences of
p
<
0.05 were considered significant.
*Group 1 vs groups 2, 3 and 4;
#
group 2 vs group 4.
*
Fig. 2. Effect of amlodipine and a high-cholesterol diet on
SOD activity. Data are expressed as mean
±
SEM (
n
=
9)
for each group. *
p
<
0.05 compared with control group,
#
p
<
0.05 compared with group 2.
6
5.5
5
4.5
4
3.5
3
2.5
2
1.5
1
0.5
0
Control
High
cholesterol
Amlodipine
High
cholesterol +
amlodipine
mtSOD (U/ml protein)
Blood
Heart
*
#
*
#
#
Fig. 3. Effect of amlodipine and a high-cholesterol diet on
GPX activity. Data are expressed as mean
±
SEM (
n
=
9)
for each group. *
p
<
0.05 compared with control group,
#
p
<
0.05 compared with group 2.
600
550
500
450
400
350
300
250
200
150
100
50
0
Control
High
cholesterol
Amlodipine
High
cholesterol +
amlodipine
GPX (U/mg protein)
Blood
Heart
#
*
*
*
*
Fig. 1. Effect of amlodipine and a high-cholesterol diet on
TBAR levels. Data are expressed as mean
±
SEM (
n
=
9)
for each group. *
p
<
0.05 compared with control group,
#
p
<
0.05 compared with group 2.
18
16
14
12
10
8
6
4
2
0
Control
High
cholesterol
Amlodipine
High
cholesterol +
amlodipine
TBARs (mmol/mg protein)
Blood
Heart
*
*
#
#
#


