CARDIOVASCULAR JOURNAL OF AFRICA • Vol 22, No 6, November/December 2011
AFRICA
321
ance (ANOVA), and if statistical significance was established,
values were compared using Turkey’s
post hoc
test. The NO
x
concentrations, and LDH and CK levels were analysed using
one-way ANOVA followed by Turkey’s test.
Results
There were no significant differences in baseline values between
all groups (Table 1). In the isolated hearts, when experimental
ischaemia was produced by the cessation of coronary perfusion,
LVDP and HR rapidly decreased and stopped. A progressive
increase in LVEDP was noted in all groups. During the reperfu-
sion periods (10, 30 and 60 min), mebudipine attenuated the
increase in LVEDP in the drug-treated group compared with
the control group (
p
<
0.01). The administration of mebudipine
before ischaemia caused cardiac function to return during the
reperfusion period. Mebudipine significantly increased the
LVDP and
+
dp/dt (time
=
10, 30 min) (
p
<
0.05), and increased
the coronary flow and – dp/dt notably (Table 1).
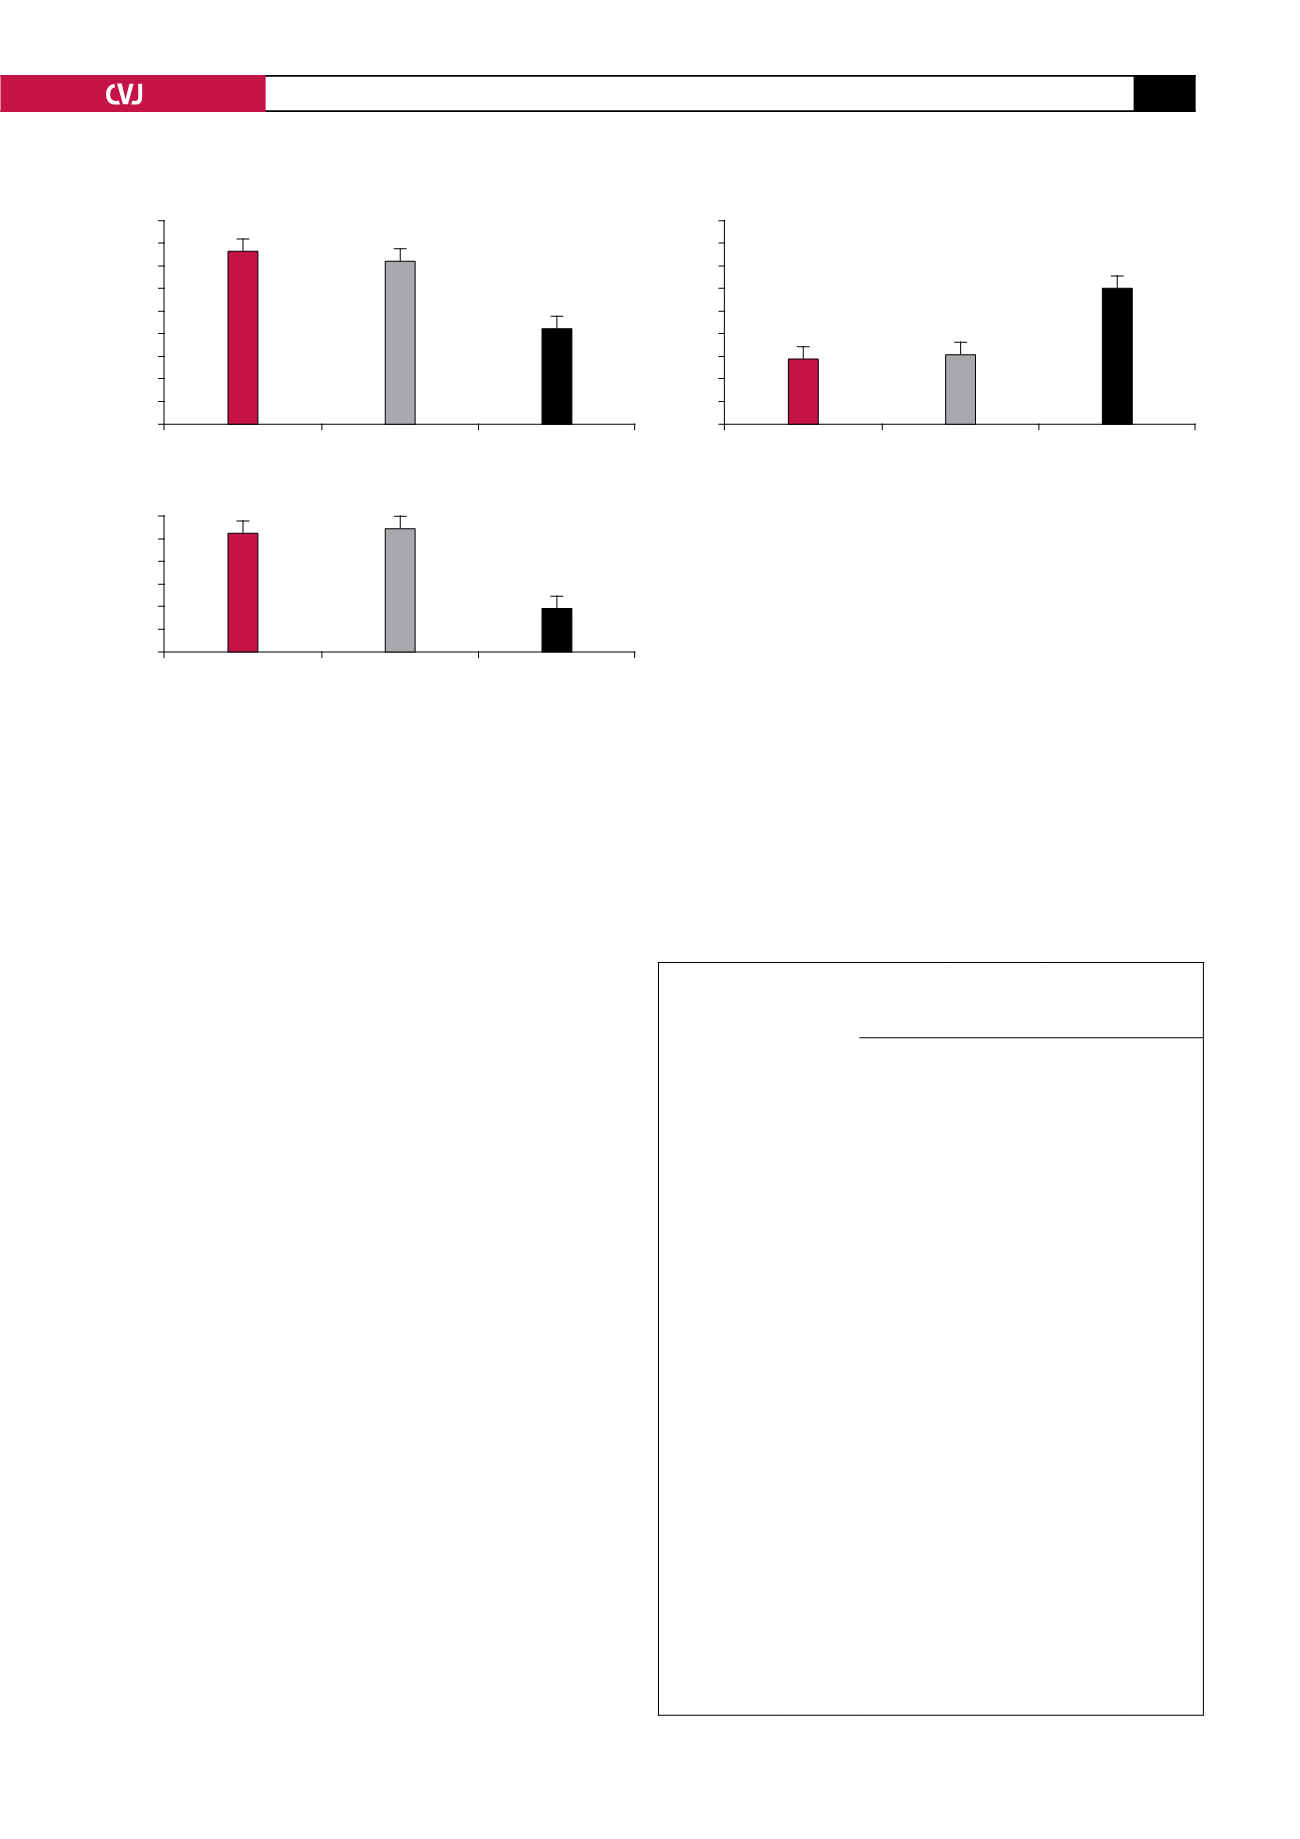
LDH and CK release in the coronary effluent, as an indicator
of cell damage and tissue injury, decreased in the drug-treated
group compared with the control group (
p
<
0.01) (Fig. 1).
Pretreatment with mebudipine (0.1 nm) increased the concentra-
tion of NO metabolites (nitrite and nitrate) in the hearts of the
drug-treated group compared with the control group (
p
<
0.01)
(Fig. 2).
Discussion
We examined the influence of mebudipine on myocardial injury
resulting from global ischaemia and reperfusion in isolated rat
hearts, determined mechanically and biochemically. The find-
ings of this study were that exposure to mebudipine 25 minutes
before global ischaemia facilitated the recovery of contractility,
decreased LDH and CK levels (indicators of cardiac cellular
injury during reperfusion), and attenuated the increase in LVEDP
during reperfusion.
Previous studies indicated that mebudipine improved char-
acteristics such as tissue selectivity and significant negative
chronotropic effects, and had no noticeable negative effect on
the contractility of the heart,
23
but there have been no studies on
the cardioprotective effects of mebudipine against ischaemia–
reperfusion injury. This is the first report that a dihydropyridine
calcium channel blocker, mebudipine, has the capability of
increasing cardiac NO levels in ischaemic hearts, which attenu-
ates the severity of the myocardial ischaemia–reperfusion injury.
It was reported that the other members of this group of drugs,
amlodipine, nifedipine and benidipine have cardioprotective
effects against myocardial ischaemia–reperfusion injury via
TABLE 1. LEVELS OF HR, LVEDP, LVDP, ± DP/DTAND CF
IN THREE GROUPS OF RATS
Parameter/group
Stabilisa-
tion
Reperfusion
10 min
30 min
60 min 120 min
HR (pulse/min)
Control
284
±
6.7 20.4
±
220 243
±
11.8 233
±
11.1 212
±
14.2
Vehicle
275
±
8.2 19.1
±
216 256
±
13.2 247
±
13.1 227
±
15.2
Drug
261
±
13.4 17.3
±
205 213
±
19.4 210
±
19.5 195
±
18.1
LVEDP (mmHg)
Control
7.4
±
0.3 2.5
±
29.3 27
±
1.5 23.8
±
1.2 19.6
±
1.1
Vehicle
7
±
0.3 3.1
±
33.3 31.1
±
1.1 26.3
±
0.9 22.5
±
1.4
Drug
6.7
*
±
0.4 1.2**
±
15.5 15.3
±
1.3** 14.5
±
1.1* 13.8
±
1.3
LVDP (mmHg)
Control
89.8
±
5.6 42
±
3.8 45
±
3.9 45.8
±
6.7 47.3
±
4.4
Vehicle
93
±
7.1 46
±
5.1 49
±
4.2 47
±
7.1 50.4
±
3.6
Drug
81.6
±
5.6 69
±
8** 67
±
7**
58
±
5.6 51.8
±
2.9
+dp/dt (mmHg/s)
Control
3388
±
310 1494
±
468 1575
±
217.5 1532
±
189 1445
±
227
Vehicle
3229
±
270 1522
±
259 1590
±
110 1585
±
233 1566
±
210
Drug
3066
±
336 439*
±
2755 2460
±
381* 2010
±
211 1920
±
200
–dp/dt (mmHg/s)
Control
1999
±
217 127
±
974 1138
±
149 1054
±
170 1014
±
150
Vehicle
1909
±
264 248
±
1050 1199
±
198 1151
±
109 1106
±
93
Drug
1863
±
259 1563
±
196 1563
±
196 1343
±
110 1301
±
89
CF (ml/min)
Control
9.8
±
0.54 7.5
±
0.18 5.3
±
0.24 4.5
±
0.18 3.9
±
0.27
Vehicle
9.5
±
0.27
6
±
0.44 4.9
±
0.27 4.3
±
0.16 3.9
±
0.24
Drug
10.1
±
0.35 8.2
±
0.88 6.1
±
0.37 5.3
±
0.38 4.6
±
0.4
Results are expressed as mean
±
SEM. for each group (
n
=
10).
*
p
<
0.05
compared with control group and
**
p
<
0.01 compared with control group.
Fig. 2. Effect of ischaemia–reperfusion on NO levels in
three groups of rats. **
p
<
0.01 compared with control
group.
180
160
140
120
100
80
60
40
20
0
NO
1
(limiting protein)
Control
Vehicle
Drug
Groups
**
900
800
700
600
500
400
300
200
100
0
LDH (U/l)
Control
Vehicle
Drug
Groups
*
Fig. 1. Effect of ischaemia–reperfusion on LDH and
CK-MB levels in three groups of rats. **
p
<
0.01 compared
with control group.
600
500
400
300
200
100
0
CK-MB (U/l)
Control
Vehicle
Drug
Groups
**


