CARDIOVASCULAR JOURNAL OF AFRICA • Vol 22, No 1, January/February 2011
16
AFRICA
PHE-induced increases in MAP, no statistically significant
differences were observed (
p
=
0.7384). Furthermore, the brady-
cardic reflex responses to increases in arterial pressure were not
different between the two groups (
p
=
0.161) (Fig. 3).
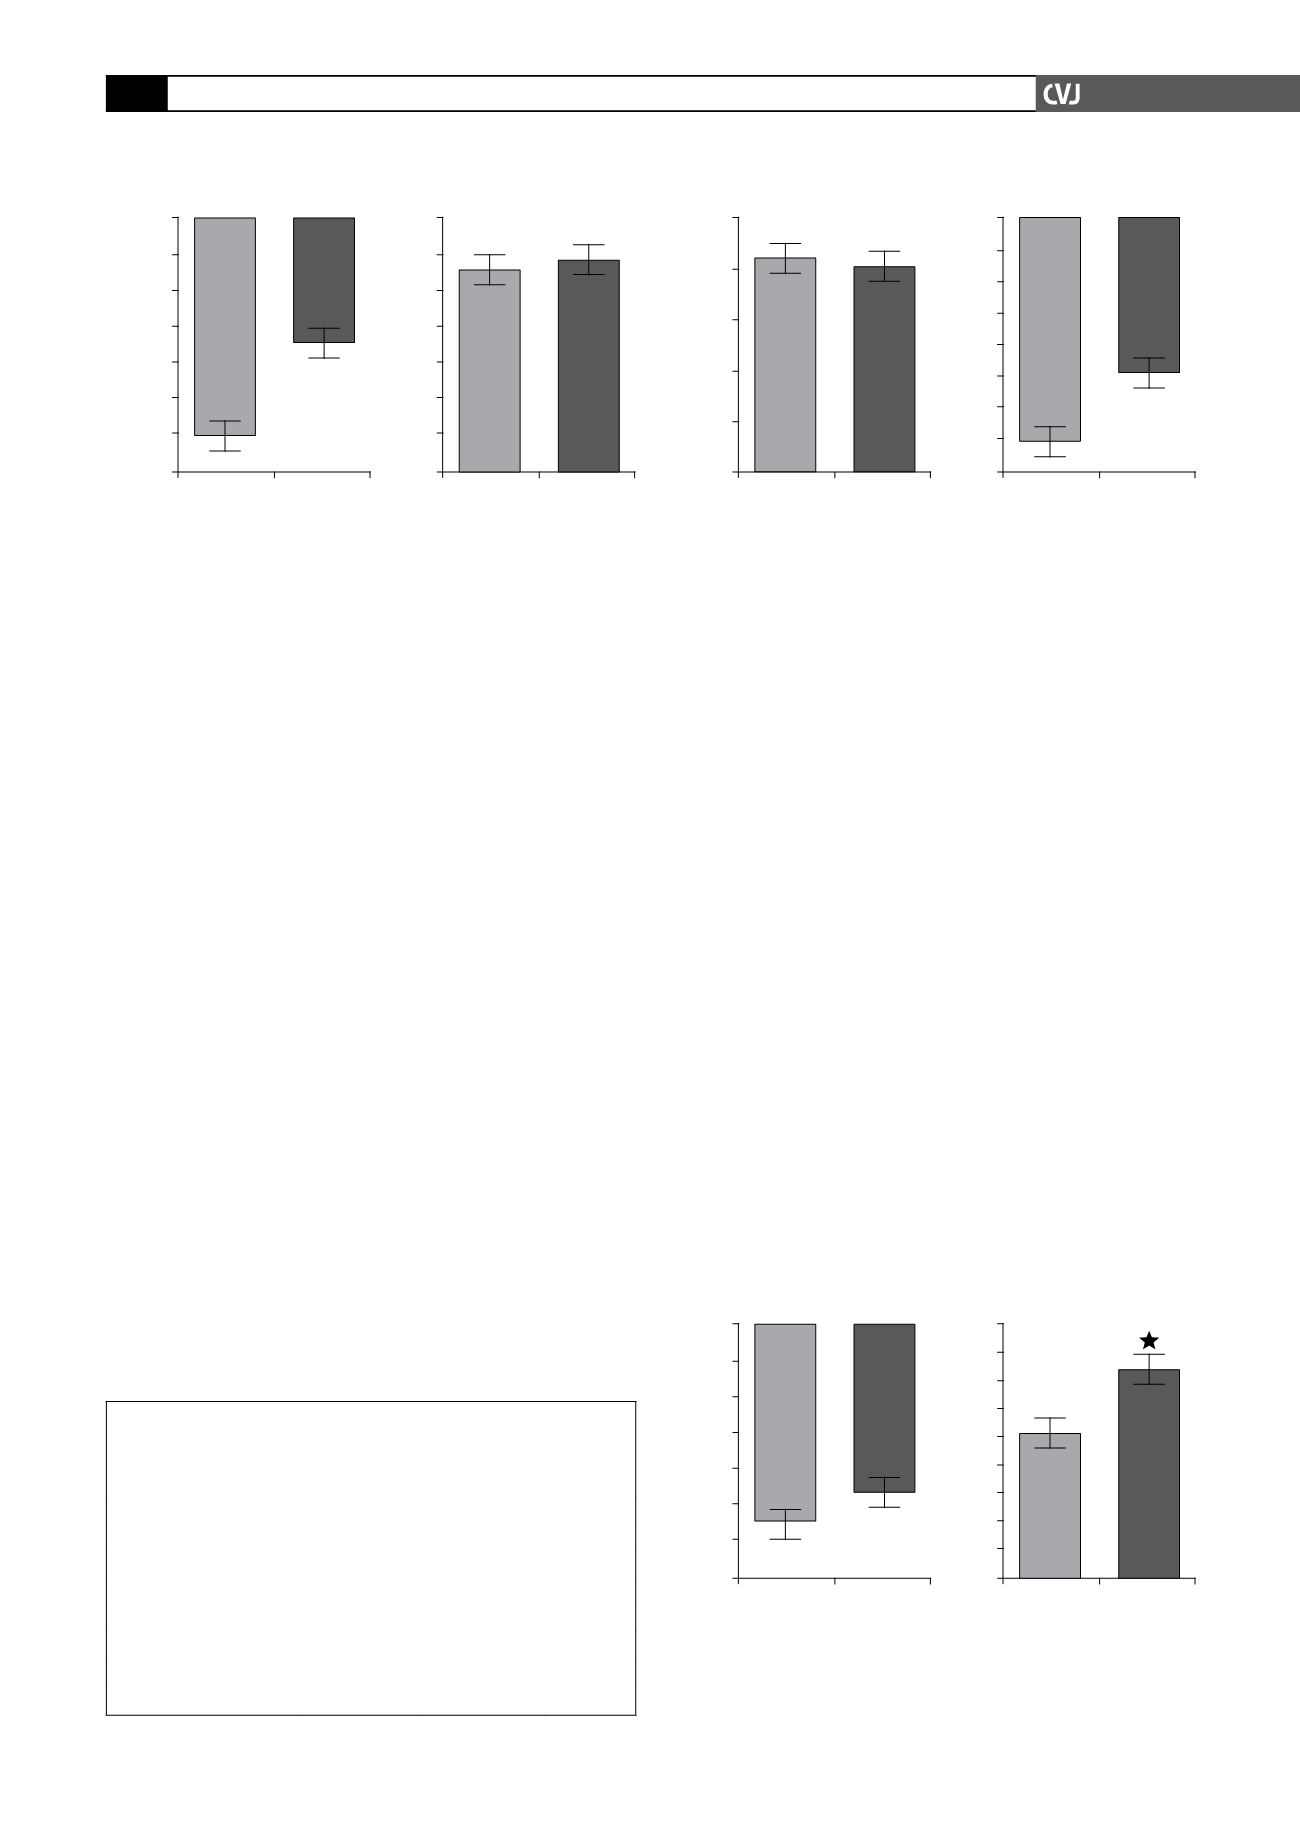
Decreases in MAP in response to SNP were similar between
the HT and LT groups (
p
=
0.6706) (Fig. 4). However, tachy-
cardic reflex responses to decreases in arterial pressure were
significantly reduced in the LT group (
p
=
0.0044).
Discussion
In this study we compared the baroreflex sensitivity between
juvenile SHRs by bolus infusions of the vasopressor PHE and
the vasodepressor SNP. Our findings demonstrate that SHRs
from the same laboratory can be divided into two groups, based
on baroreflex gain (HB vs LB groups, due to parasympathetic
responses, and LT vs HT groups, due to sympathetic responses).
We compared these groups and found that the parasympa-
thetic component of the baroreflex gain and the bradycardic
reflex response to increases in arterial pressure were signifi-
cantly reduced in approximately 63% of the rats investigated.
We also found that the sympathetic component of the baroreflex
gain and the tachycardic reflex in response to reductions in blood
pressure were significantly reduced in approximately 73% of the
rats studied. Considering that no ketamine effect remains in rats
after 24 hours with regard to baroreflex tests,
13
we discarded the
possibility of any interference of this drug in our study.
In this study, baroreflex function was examined by bolus
infusions of vasopressors and depressors and we measured HR
changes in response to arterial pressure increases or decreases,
caused by the intravenous infusion of SNP or PHE, respectively.
According to our findings, approximately 63% of 19 SHRs (LB
group) presented with reduced bradycardic reflex responses
to increases in arterial pressure and decreased baroreflex gain,
tested with the
α
1
-adrenergic agonist PHE. Baseline HR tended
to be reduced in the LB group. However, it did not reach statisti-
cal significance (
p
=
0.0527). Furthermore, the LB group also
demonstrated a reduced tachycardic peak and HR range. This
was probably due to a lower plateau of HR (maximal bradycardic
response) as well as a higher plateau of HR (maximal tachycard-
ic response), although the bradycardic peak was not statistically
significantly different.
We concluded that approximately one in four SHRs demon-
strated a significant increase in reflex tachycardic gain. Much
attention has been focused on the role of sympathetic activ-
ity regarding the onset of hypertension in the SHR. Previous
research has shown an elevation of sympathetic drive to blood
vessels in awake SHRs and has suggested that this is important
in the maintenance of increased blood pressure.
14,15
It is possi-
ble that this elevation in sympathetic output is not primarily a
consequence of changes in either the baroreceptor reflex
15
or
chemoreflex function, but rather, is a product of a modification
of the central neural circuitry involved in generating the sympa-
thetic output.
16
In view of the above considerations, although there were no
significant alterations with regard to basal MAP and HR between
the HT and LT groups, we may not discard the possibility that
TABLE 2. BASELINE LEVEL OF MEANARTERIAL PRES-
SURE (MAP) AND HEART RATE (HR), BRADYCARDICAND
TACHYCARDIC PEAK, HR RANGEAND BAROREFLEX
GAIN (BG) LT (
n
=
13) AND HT (
n
=
5) GROUPS. MEAN
±
SEM
Variable
Group 3
Group 4
p
-value
MAP (mmHg)
163.3
±
3.42 158.4
±
3.59 0.4278
HR (bpm)
352.15
±
11.5 347
±
17.3 0.821
Bradycardic peak (bpm) 314.15
±
12.5 309.6
±
17.17 0.8448
Tachycardic peak (bpm) 486.5
±
10.2 499
±
20.6 0.5548
HR range (bpm)
182.1
±
16.2 189.4
±
25.97 0.8143
BG (bpm.mmHg
-1
) PHE –0.91
±
0.12 –0.68
±
0.09 0.2812
BG (bpm.mmHg
-1
) SNP –1.96
±
0.16 –3.93
±
0.4
<
0.0001
0
–10
–20
–30
–40
–50
–60
–70
Group 1 Group 2
∆
MAP (mmHg)
140
120
100
80
60
40
20
0
Group 1 Group 2
∆
HR (bpm)
Fig. 2. Decrease in mean arterial pressure (MAP, mmHg)
and decrease in heart rate (HR, bpm) in response to
sodium nitroprusside (SNP, 50
m
g/kg i.v.) in HB (
n
=
7) and
LB (
n
=
12) groups. Mean
±
SEM.
50
40
30
20
10
0
Group 3 Group 4
∆
MAP (mmHg)
0
–5
–10
–15
–20
–25
–30
–35
–40
Group 3 Group 4
∆
HR (bpm)
Fig. 3. Increase in mean arterial pressure (MAP, mmHg)
and decrease in heart rate (HR, bpm) in response to
phenylephrine (PHE, 8
m
g/kg i.v.) in LT (
n
=
13) and HT (
n
=
5) groups. Mean
±
SEM.
0
–10
–20
–30
–40
–50
–60
Group 3 Group 4
∆
MAP (mmHg)
180
160
140
120
100
80
60
40
20
0
Group 3 Group 4
∆
HR (bpm)
Fig. 4. Decrease in mean arterial pressure (MAP, mmHg)
and decrease in heart rate (HR, bpm) in response to
sodium nitroprusside (SNP, 50
m
g/kg i.v.) in LT (
n
=
13)
and HT (
n
=
5) groups. *
p
<
0.005: different from LT group.
Mean
±
SEM.


