CARDIOVASCULAR JOURNAL OF AFRICA • Vol 23, No 1, February 2012
AFRICA
35
was calculated by the Simpson method.
Intra-operative TEE was performed on all patients included in
the study after the induction of anesthesia. Interatrial conduction
times were measured as published previously.
8
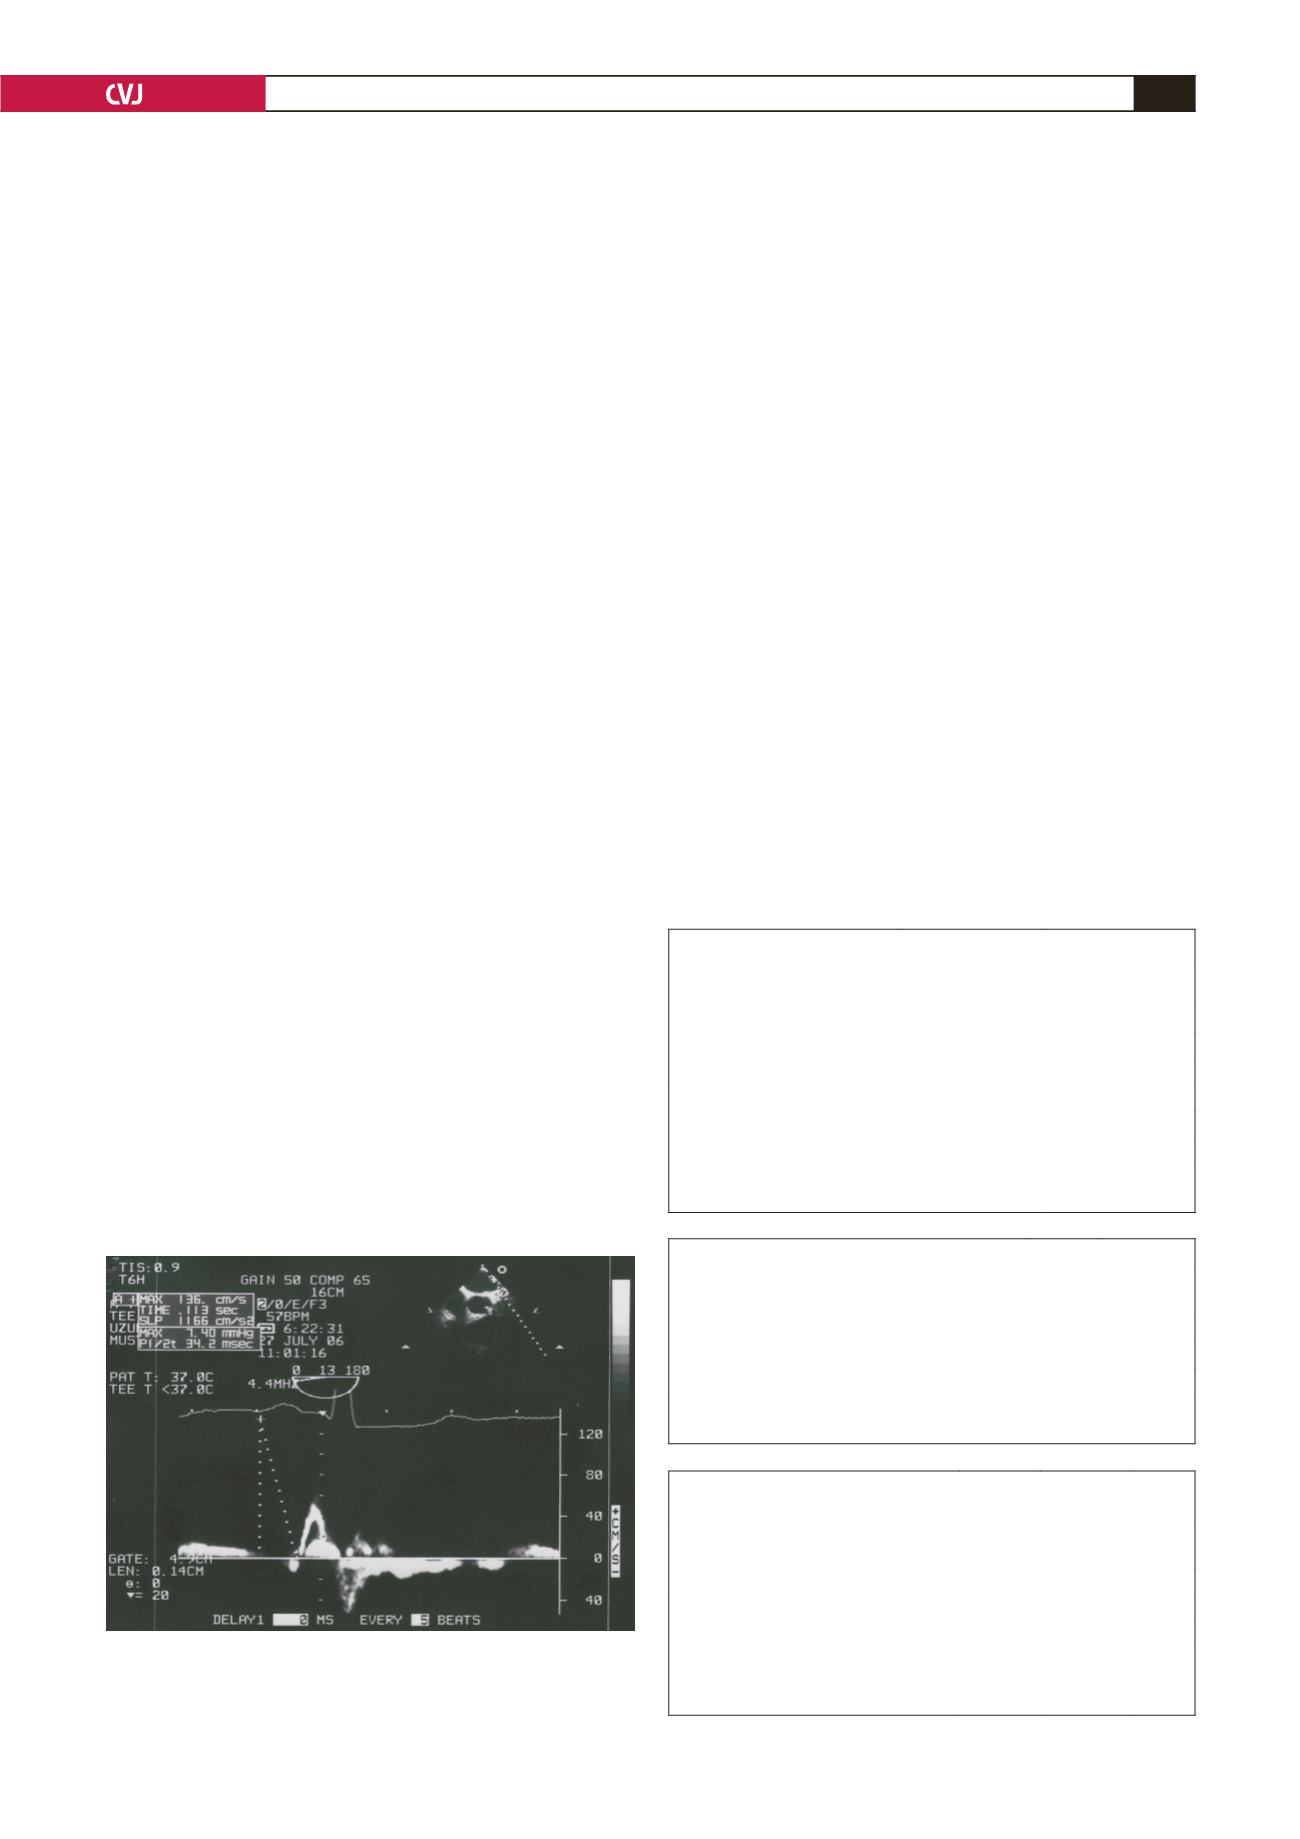
The time between the origin of the P wave on the surface
electrocardiogram and the left atrial appendage ejection flow
(P-LAA) was measured by TEE and defined as interatrial
conduction time (Fig. 1). The cross-clamp time was also reported.
Patients with at least one atrial fibrillation episode after surgery
during the hospitalisation period were placed into group 1 and
the patients without episodes were in group 2. We compared the
interatrial conduction times between these two groups.
Statistical analysis
Data are expressed as mean
±
SD for continuous data and as
number and percentage for categorical data. A
p
-value
<
0.05
was considered significant. Differences between groups were
compared with the Student’s
t
-test on SPSS.
Results
A total of 59 patients in sinus rhythm were included in the study.
Thirty-nine of the patients were operated on for coronary artery
disease only, and 14 for valvular heart disease only. Six of the 59
patients were operated on for both coronary artery and valvular
heart disease. Atrial fibrillation was observed in 22 patients
(37%) in the follow-up period. Baseline clinical characteristics
were not statistically different between the two groups.
Intravenous and oral amiodarone was initiated for patients
developing post-operative atrial fibrillation. In two of the
cases, electrocardioversion was necessary for maintaining sinus
rhythm. All of the patients were discharged from the hospital in
sinus rhythm. The frequency of occurrence of atrial fibrillation
was similar to that reported recently. The clinical properties are
summarised in Table 1.
Atrial fibrillation has been detected more frequently in
females than males (46 vs 30%). In our study, hypertension
was more common in patients with atrial fibrillation than those
without but the difference did not reach statistical significance.
Additionally, patients with atrial fibrillation were older, although
the difference did not reach statistical significance. Valvular
heart disease seemed more likely to cause atrial fibrillation than
coronary artery disease within the postoperative period (Table 2).
The echocardiographic properties are summarised in Table 3.
The mean left atrial diameter was slightly larger in group 1, and
the mean left ventricular ejection fraction was slightly reduced
but these values were not statistically significant.
Mean interatrial conduction time was 74
±
15.9 ms in group 1
and 54
±
7.9 ms in group 2. The difference in interatrial conduc-
tion time between the two groups was statistically significant (
p
<
0.05). Mean cross-clamp time was 32.2
±
9.5 minutes and there
was no statistically significant difference between the groups.
Discussion
Postoperative atrial fibrillation causes prolongation of hospital
stay and it is a frequent complication occurring in 30 to 50%
of the patients after cardiac surgery.
9
There are many defined
clinical risk factors for atrial fibrillation following cardiac
surgery. Previous studies have shown that age and hypertension
are important risk factors for atrial fibrillation.
10
However in our
study, there was no statistically significant difference between
the two groups, possibly because our study population was too
small to detect a difference.
Recent clinical trials have investigated echocardiographic
parameters for the prediction of postoperative atrial fibrillation.
P-wave duration on surface ECG and P-wave dispersion were
found to be important and easily obtainable parameters for the
TABLE 1. CLINICAL PROPERTIES OF THE PATIENTS
Group 1*
(
n
=
22)
Group 2**
(
n
=
37)
Mean age (years)
66
±
5
66
±
6
Male/female (
n
)
10/12
23/14
Hypertension,
n
(%)
16 (72)
21 (56)
Diabetes mellitus,
n
/(%)
8 (36)
16 (43)
Smoking,
n
(%)
13 (59)
19 (51)
Mean follow-up time (days)
6.7
±
1.0
6.6
±
0.8
*Patients with atrial fibrillation episode in follow up.
**Patients without atrial fibrillation episode in follow up.
TABLE 2. INDICATIONS OF THE SURGERY
Group 1*
(
n
=
22)
Group 2**
(
n
=
37)
Coronary artery disease (
n
)
13
26
Valvular heart disease (
n
)
12
2
Both coronary artery and valvular heart disease (
n
)
5
1
*Patients with atrial fibrillation episode in follow up.
**Patients without atrial fibrillation episode in follow up.
Fig. 1. P-LAA was measured as the time interval from
the initiation of the P wave on surface ECG to the start
of the left atrial appendix ejection flow demonstrated by
transoesophageal echocardiography.
TABLE 3. ECHOCARDIOGRAPHIC PROPERTIES OF THE
PATIENTS
Group 1*
(n = 22)
Group 2**
(n = 37)
p
-value
Left ventricular diastolic diameter (mm) 52
±
6 51
±
6
NS
Left atrial diameter (mm)
39
±
5 38
±
4
NS
Left ventricular ejection fraction (%)
46
±
8 47
±
7
NS
*Patients with atrial fibrillation episode in follow up.
**Patients without atrial fibrillation episode in follow up.
NS = not significant.


