CARDIOVASCULAR JOURNAL OF AFRICA • Vol 23, No 2, March 2012
80
AFRICA
Caucasian hypertensive women showed significant correlations
of log CRP with both SV and Cw (Table 3). Conversely, hyper-
tensive African women showed highly significant correlations
of log CRP with all cardiovascular variables (excluding DBP)
(Table 3).
In Table 4, the hypertensive Caucasian women showed posi-
tive associations between log cortisol and the vascular markers
Cw and DBP. On the other hand, hypertensive African women
only exhibited positive associations between log cortisol and
TPR and SBP.
Stepwise forward regression analyses (Table 5) revealed that
the cardiac (SBP and SV) and vascular markers (Cw) predicted
hypertension in African women. In Caucasian women, only SBP
predicted hypertension.
Discussion
The aim of this study was to investigate the contribution of
TABLE 1. DESCRIPTIVE STATISTICS OF CARDIOVASCULAR
ANDANTHROPOMETRICVARIABLES BETWEEN
AFRICANAND CAUCASIANWOMEN
African women
mean (95 % CI)
n
=
102
Caucasian women
mean (95% CI)
n
=
115
Age
31.12 (29.43; 32.81)
30.98 (29.17; 32.79)
WC (cm)
81.62 (79.02; 84.22)
a
85.98 (83.18; 88.76)
a
BMI (kg/m
2
)
27.98 (26.74; 29.23)
28.51 (27.16; 29.85)
SBP (mmHg)
129.82 (125.97; 133.66)
b
125.24 (123.03; 127.45)
b
DBP (mmHg)
77.68 (75.58; 79.78)
c
72.30 (70.61; 73.99)
c
CO (l/min)
5.72 (5.49; 5.95)
d
7.09 (6.73; 7.45)
d
SV (ml)
84.67 (81.84; 87.51)
e
97.94 (93.14; 102.74)
e
TPR (mmHg/s/ml)
1.10 (1.04; 1.15)
f
0.84 (0.80; 0.88)
f
Cw (ml/mmHg)
1.85 (1.79; 1.91)
g
2.29 (2.21; 2.36)
g
hs-CRP (mg/l)
5.54 (3.19; 7.88)
3.29 (2.57; 4.01)
Cortisol (nmol/ml) 455.74 (402.37; 509.11)
h
604.90 (545.23; 664.56)
h
CI, confidence interval; WC, waist circumference; BMI, body mass index;
SBP, systolic blood pressure; DBP, diastolic blood pressure; CO, cardiac
output; SV, stroke volume; TPR, total peripheral resistance; Cw, Windkes-
sel compliance; hs-CRP, high-sensitivity C-reactive protein.
All data were adjusted for age, smoking and alcohol consumption and
tested at a 95% confidence interval.
Significant differences (
p
≤
0.05) between variables in the groups are
indicated with the same superscript letters.
TABLE 2. CARDIOVASCULARANDANTHROPOMETRICVARIABLES BETWEEN NORMOTENSIVE
AND HYPERTENSIVEAFRICANAND CAUCASIANWOMEN
African women
Caucasian women
Normotensive (NT)
n
=
81
Hypertensive (HT)
n
=
21
Normotensive (NT)
n
=
100
Hypertensive (HT)
n
=
12
Age
30.02 (28.28; 31.77)
a
36 (31.49; 40.51)
a
30.76 (28.94; 32.59)
35.58 (29.15; 42.02)
BMI (kg/m
2
)
27.31 (25.96; 28.65)
b
30.59 (27.51; 33.67)
b
27.94 (26.54; 29.34)
31.79 (26.54; 37.05)
WC (cm)
80.01 (77.17; 82.86)
c
87.81 (81.83; 93.79)
c
84.54 (81.65; 87.42)
h
94.60 (84.37; 104.83)
h
SBP (mmHg)
122.93 (120.90; 124.96)
d
156.37 (144.58; 168.15)
d
122.05 (120.43; 123.67)
i
146.91 (138.81; 155.00)
i
DBP (mmHg)
74.34 (72.50; 76.18)
e
90.58 (86.53; 94.64)
e
70.89 (69.27; 72.51)
j
82.12 (75.12; 89.13)
j
hs-CRP (mg/l)
5.55 (2.64; 8.45)
5.50 (3.04; 7.95)
3.27 (2.45; 4.10)
3.50 (2.05; 4.95)
Cortisol (nmol/ml)
462.24 (397.84; 526.63)
430.68 (348.22; 513.15)
610.29 (545.70; 674.88)
534.87 (318.67; 751.07)
CI, confidence interval; hs-CRP, high-sensitivity C-reactive protein; WC, waist circumference; BMI, body mass index; SBP, systolic blood pres-
sure; DBP, diastolic blood pressure. All data were adjusted for age, smoking and alcohol consumption and tested at a 95% confidence interval.
Significant differences (p
≤
0.05) between variables in the groups are indicated with the same superscript letters.
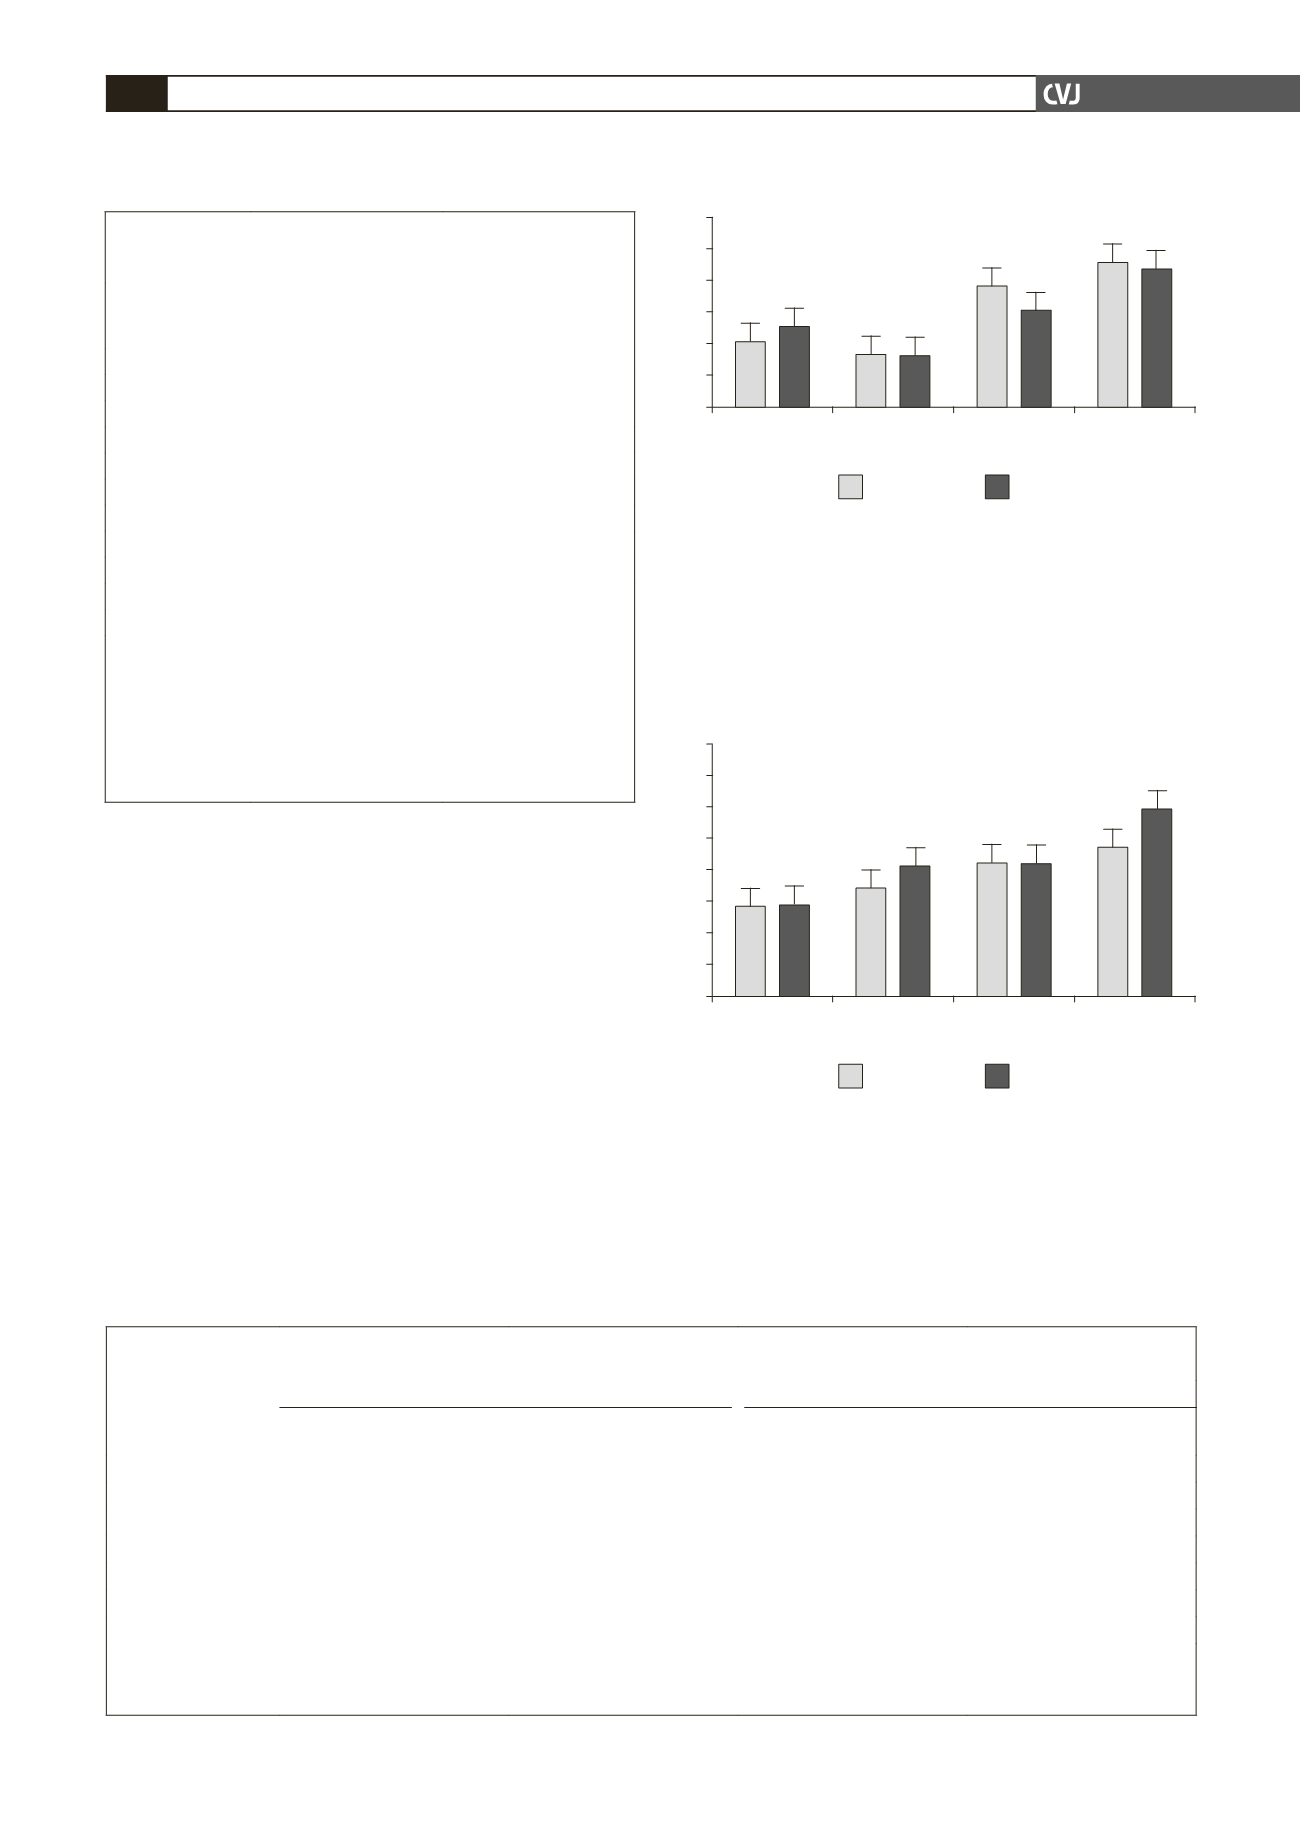
Fig. 1. Resting mean (
±
SD) vascular responses of African
and Caucasian women between normotensive (BP
≤
140/90 mmHg) and hypertensive (BP
≥
140/90 mmHg)
groups. SD, standard deviation; BP, blood pressure; TPR,
total peripheral resistance (mmHg/s/ml); Cw, Windkessel
compliance (ml/mmHg); NT, normotensive; HT, hyperten-
sive. Values are adjusted for age, smoking and alcohol
consumption and tested at a 95% confidence interval.
Bars with the same superscript letter differ significantly.
3
2.5
2
1.5
1
0.5
0
TRP
Africans
TPR
Caucasians
Cw
Africans
Cw
Caucasians
NT
HT
Fig. 2. Resting mean (
±
SD) cardiac responses of African
and Caucasian women between normotensive (BP
≤
140/90 mmHg) and hypertensive (BP
≥
140/90 mmHg)
groups. SD, standard deviation; BP, blood pressure; CO,
cardiac output (l/min); SV, stroke volume (l); NT, normo-
tensive; HT, hypertensive. Values are corrected for age,
smoking and alcohol consumption and tested at a 95%
confidence interval. Bars with the same superscript letter
differ significantly.
16
14
12
10
8
6
4
2
0
CO
Africans
CO
Caucasians
SV
Africans
SV
Caucasians
NT
HT
a
a
b
b
a
a
b
b


