CARDIOVASCULAR JOURNAL OF AFRICA • Vol 23, No 2, March 2012
AFRICA
87
the SBP readings by consultant staff ended in the digit 0, 56.3%
of the readings by registrars and 63.5% of those by senior regis-
trars ended in the digit 0 (
p
<
0.001). Although the consultant
staff recorded a higher frequency of end digit 0 for DBP than
SBP (42.3%), the frequency of end digit 0 was still lower than
that by registrars (67.8%) and senior registrars (77.8%), and this
difference was statistically significant (
p
<
0.001).
A comparison of the characteristics of the patients was made
in those whose SBP and DBP readings ended with end digit
0 and those with non-zero end digits (Table 3). There was no
significant difference in the gender, and mean age, weight,
height and body mass index of those with end digit 0 compared
with those with non-zero end digits.
Discussion
A zero EDP of 98.5% of SBP and DBP readings by nurses in
our clinic was much higher than the 22.2–40.8% of SBP and
21.8–53.6% of DBP readings by hypertension nurse specialists
at the Mayo Clinic, Rochester, as reported by Graves
et al
.
17
These differences in the frequency of zero EDP may be due to
the differences in the degree of training of our nurses and those
of the Mayo Clinic, since our nurses are not specially trained to
run the hypertension clinic. Our findings argue for specialisation
or retraining of the nurses involved in running the hypertension
clinic in order to improve their clinical competence in BP meas-
urement and documentation.
The zero EDP of 51.2% of SBP and 64.3% of DBP readings
by doctors in our clinic was much higher than the expected 20%.
Although a zero EDP of 51.2% of SBP readings was lower than
the 60–84% reported in most clinical practice-based studies,
8,14-16
we expected a lower frequency than this. This assumption was
based on the premise that doctors working in the hypertension
specialty clinic should have acquired clinical competence in BP
measurement.
The zero EDP of 64.3% of DBP readings in our study is
similar to the 64% obtained by Kim
et al.
,
14
the 65% by Patterson
et al.
,
8
and the 62% by Broad
et al
.,
15
but higher than the 36%
obtained by Thavarajah
et al
.
11
in a similar hypertension specialty
clinic setting.
Subgroup analysis of the readings by doctors showed that the
consultant staff had the least preference for end digit zero in their
BP measurements, although the findings of a zero EDP of 25.4%
of SBP and 42.3% of DBP were higher than the expected 20%.
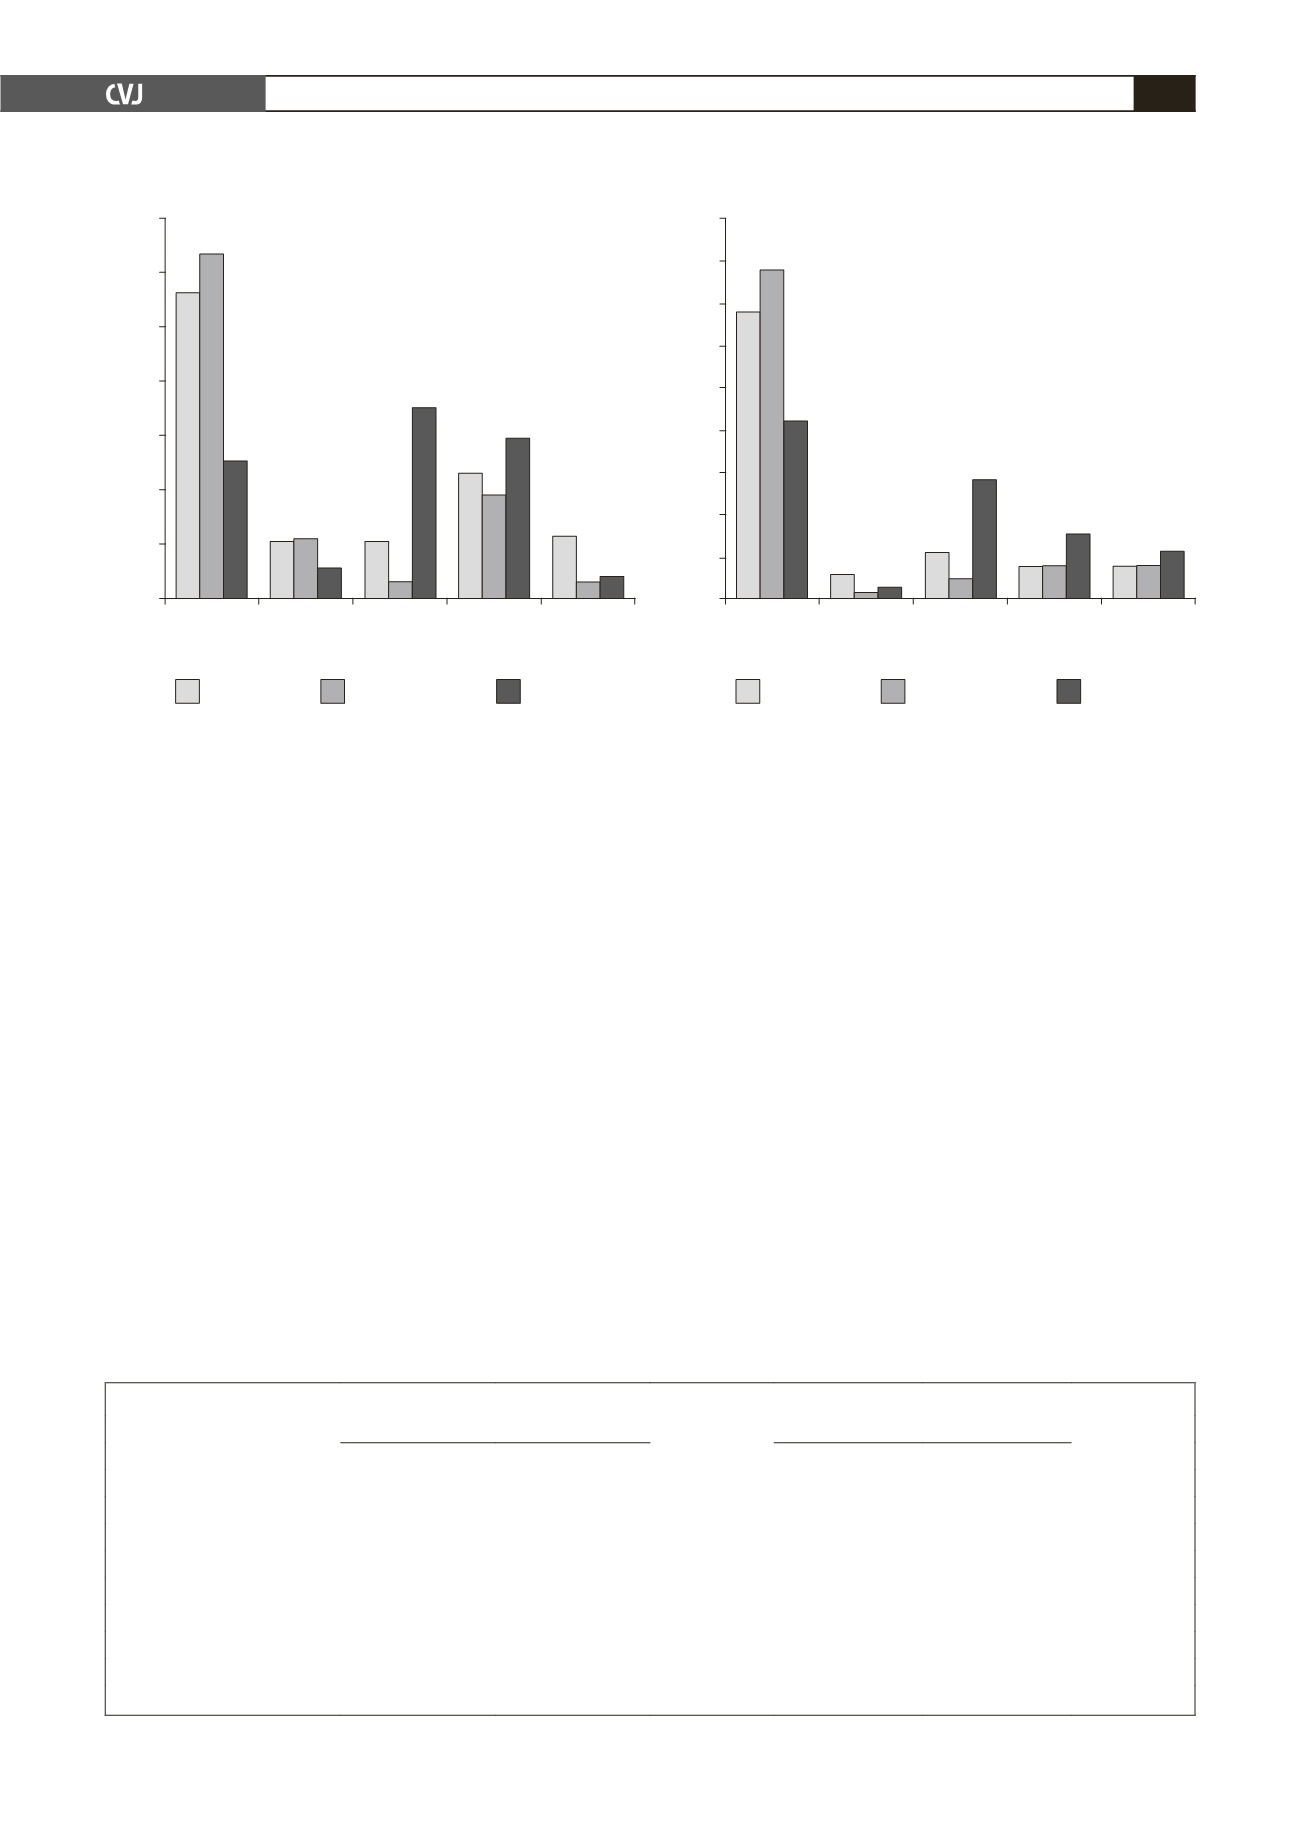
Fig. 1. Percentage of systolic blood pressure end digit
values among different cadres of doctors.
70
60
50
40
30
20
10
0
0
2
4
6
8
percentage of readings
registrar
snr registrar
consultant
last digit of systolic blood pressure reading
56.3
63.5
25.4
35.2
23.1
29.6
19
11.5
4.2 3.2
3.2
10.6
10.6 11.1
5.6
p
<
0.001
Fig. 2. Percentage of diastolic blood pressure end digit
values among different cadres of doctors.
90
80
70
60
50
40
30
20
10
0
0
2
4
6
8
percentage of readings
registrar
snr registrar
consultant
last digit of diastolic blood pressure reading
67.8
77.8
42.2
28.2
7.7
15.5
7.9
7.7
11.3
7.9
4.8
11
5.8
1.6 2.8
p
<
0.001
TABLE 3. CHARACTERISTICS OF PATIENTS BY END DIGITS OF BLOOD PRESSURE READINGS
Patients’ characteristics
SBP readings end digits
p
-value
DBP readings end digits
p
-value
Zero (%)
Non-zero (%)
Zero (%)
Non-zero (%)
Gender
Male
17 (45.9)
20 (54.1)
0.465
24 (64.9)
13 (35.1)
0.519
Female
41 (53.2)
36 (46.8)
46 (59.7)
31 (40.3)
Mean age (years)
61.9
±
11.7
63.2
±
13.2
0.569
62.9
±
11.4
62.0
±
14.1
0.718
Mean weight (kg)
68.99
±
16.66
72.63
±
14.18
0.214
71.4
±
16.8
69.8
±
13.3
0.599
Mean height (m)
1.63
±
0.07
1.63
±
0.07
0.878
1.63
±
0.07
1.63
±
0.08
0.897
Mean BMI (kg/m
2
)
26.2
±
5.9
27.6
±
6.0
0.253
26.9
±
6.5
26.8
±
5.0
0.908
Mean BP (mmHg)
139.5
±
29.9
139.0
±
18.5
0.924
80.4
±
13.6
80.1
±
12.3
0.908
BMI – body mass index, BP – blood pressure.


