CARDIOVASCULAR JOURNAL OF AFRICA • Vol 23, No 2, March 2012
AFRICA
107
two-year period for mortality in relation to the level of physical
activity, blood pressure and other risk factors.
21
In this retrospec-
tive cohort of older individuals, serum albumin, diabetes status
and waist/hip ratio were predictors of two-year mortality.
Cohorts of risk factors and trajectories over time or
hard outcomes
Child and adolescent cohorts of CVD and its risk factors
: the
‘Mandela’s children’ cohort is the largest and longest ongo-
ing African initiative regarding child and adolescent health.
88-90
The study started in 1989/1990 with 3 273 newborn infants in
Soweto, South Africa.
109,110
It was initially designed for a 10-year
follow-up duration and labelled Birth-To-Ten Cohort; this
changed to Birth-To-Twenty when the duration was extended to
20 years.
111
A major contribution to cardiovascular epidemiol-
ogy has been the study of the trajectories of cardiovascular risk
factors in this cohort.
88,89
The Ellisras Longitudinal Study (ELS) is an ongoing study
of the growth and health of rural South African children. It was
initially designed as a mixed longitudinal study to investigate
the growth and nutritional status of rural South African children
attending pre-primary and primary school (3–10 years old).
95
Initial data collection was limited to anthropometric assessment,
however from the year 2000, data were also collected on blood
pressure variables.
93,94,96,97
Baseline data provided information on
the prevalence of risk factors, particularly obesity
98
and hyperten-
sion.
94
The follow up will provide additional information regard-
ing changing trends with time.
Blood pressure variables and control of hypertension
: the Luo
Migration Study in Kenya provided a picture of the changing
pattern of blood pressure variables with time. Some predictors
of these changes were the result of migrating from rural to urban
areas.
41,49-51
The dropout rate was very high, with only 35% of the
original sample available for the final evaluation.
The International Collaborative Study on Hypertension in
Blacks (ICSHIB) was a comparative study on hypertension and
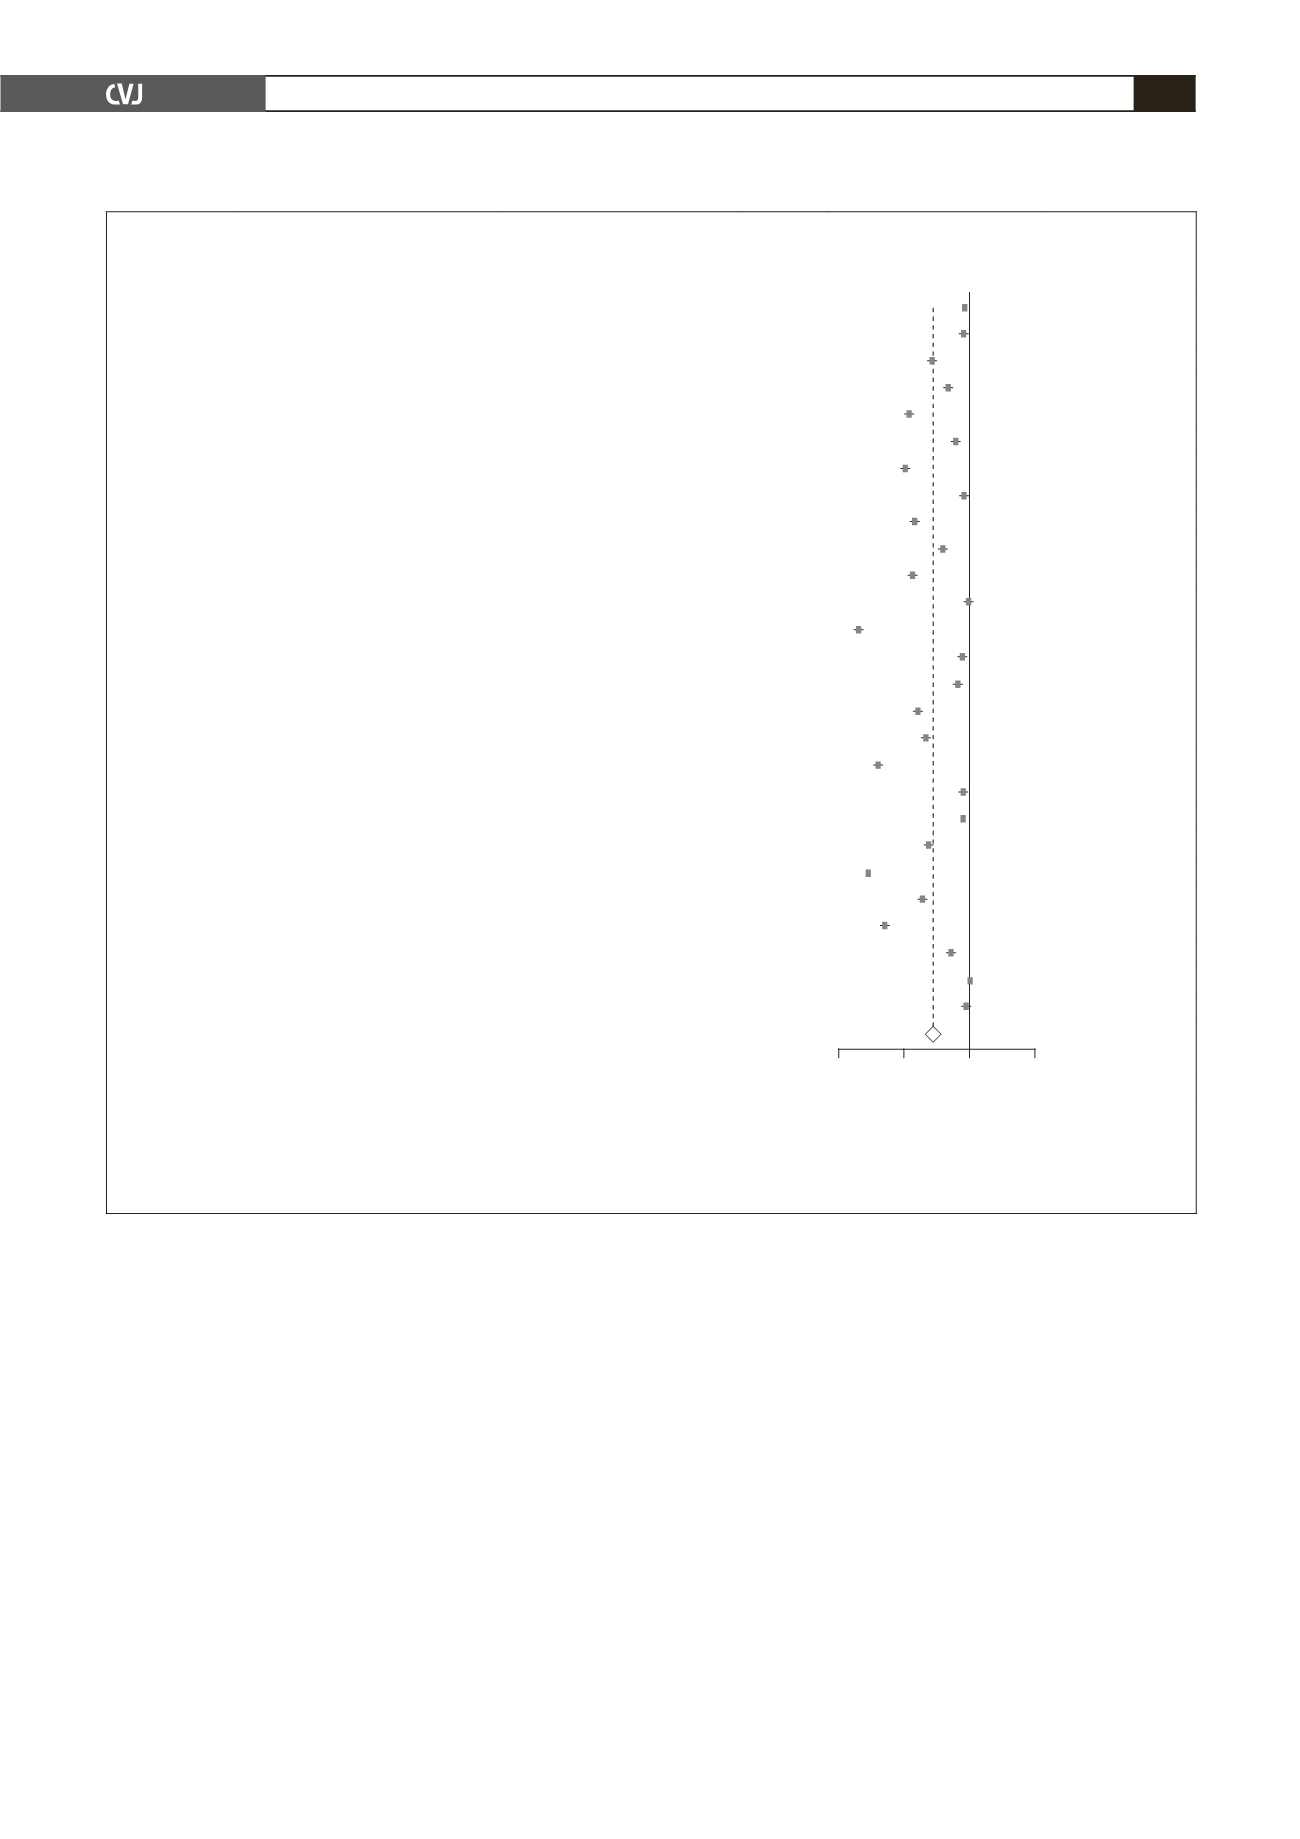
TABLE. 2. PROPORTION OF PARTICIPANTS TRACEDAT THE END OF FOLLOW UP
19-45
First author
and reference Study country
Main focus
Year
published
Ratio final/baseline number of participants and
95% confidence interval
Azura
19
Nigeria
Adult mortality
2000
0.0 0.5 1.0 1.5
0.95 (0.95–0.96)
Castle
20
Zimbabwe
Diabetes mellitus
1980
0.95 (0.91–0.99)
Charlton
21
South Africa
Causes of deaths
1997
0.71 (0.65–0.77)
Cohen
22
South Africa
Cardiovascular diseases
1978
0.83 (0.77–0.88)
Davidson
23
Nigeria
Peripartum heart failure
1975
0.53 (0.47–0.60)
Dewar
24
South Africa
Post-stroke
1990
0.89 (0.84–0.93)
Digenio
25
South Africa
Cardiac rehabilitation
1992
0.50 (0.46–0.54)
Elamin
27
Sudan
Type 1 diabetes
1992
0.95 (0.92–0.97)
Fadahunsi
26
Nigeria
Rheumatic heart disease
1987
0.58 (0.48–0.68)
Ford
28
Nigeria
Peripartum heart failure
1998
0.79 (0.74–0.84)
Gill
29
South Africa
Type 1 diabetes
2005
0.56 (0.45–0.66)
Haitas
30
South Africa
Familial hypercholesterolaemia 1990
0.98 (0.94–1.02)
Jackson
31
South Africa
Diabetes mellitus
1974
0.15 (0.11–0.19)
Koegelenberg
32
South Africa
Infective endocarditis
2003
0.93 (0.88–0.99)
Lang
33
Senegal
Hypertension in pregnancy 1993
0.90 (0.88–0.93)
Lester
34
Ethiopia
Diabetes mellitus
1988
0.60 (0.58–0.62)
Lester
35
Ethiopia
Diabetes mellitus
1990
0.66 (0.60–0.73)
Luke
36
Nigeria
Blood pressure and weight
2006
0.30 (0.27–0.33)
Mayosi
37
Cameroon, Nigeria, South Africa Tuberculous pericarditis
2008
0.94 (0.91–0.97)
McLarty
38
Tanzania
Diabetes mellitus
1990
0.94 (0.93–0.96)
Motala
39
South Africa
Glucose intolerance
1997
0.68 (0.60–0.76)
Motala
45
South Africa
Type 2 diabetes
2003
0.23 (0.21–0.24)
Okonofua
40
Nigeria
Blood pressure in pregnancy 1992
0.63 (0.58–0.68)
Poulter
41
Kenya
Blood pressure
1990
0.35 (0.31–0.39)
Raimaiya
42
Tanzania
Glucose tolerance
1990
0.85 (0.81–0.90)
Reid
43
South Africa
Mortality
1996
0.99 (0.99–0.99)
Walker
44
Gambia
Post-stroke
2003
0.96 (0.93–1.00)
0.72 (0.64–0.80)
Random effect: test for heterogeneity: Q
=
12259.319 on 26 degrees of freedom (
p
<
0.001); I
2
=
99.8; ratio of number of participants at the
completion vs the number at baseline (boxes) and 95% confidence interval (horizontal lines about the boxes) for 27 studies. When studies were
stratified by date of publication [i.e.
≤
1990 (11 studies) vs after 1990 (16 studies)], there was similar significant heterogeneity within subgroups
(both
p
<
0.001), but not between the two subgroups (Q
=
0.059,
p
=
0.808). The results remained unchanged when studies were stratified by dura-
tion of follow up [i.e.
<
10 years (18 studies) vs
≥
10 years (9 studies)], (Q
=
0.089,
p
=
0.765).


