CARDIOVASCULAR JOURNAL OF AFRICA • Volume 25, No 1, January/February 2014
AFRICA
35
criteria were patients with moderate to severe MS, defined by
planimetry as mitral valve area (MVA) of less than 1.5 cm
2
,
who were undergoing heart catheterisation, had no more than
moderate mitral or aortic regurgitation, and the absence of aortic
or tricuspid stenosis. To include these 33 patients, we screened
36 patients. Three were excluded; two had moderate to severe
MR and one had moderate to severe AR.
The reasons for undergoing heart catheterisation in patients
with MS in our hospital are diagnostic coronary angiography
before mitral valve surgery or performing percutaneous
transvenous mitral commissurotemy. All patients were
evaluated in the left lateral decubitus position by conventional
(two-dimensional, M-mode and colour Doppler) and tissue
Doppler echocardiography examinations, a maximum of
three hours before cardiac catheterisation, by an experienced
echocardiologist.
The institutional review board of Imam Khomeini Hospital,
which is a tertiary hospital, approved the study protocol. All
participants gave written informed consent. This investigation
was in accordance with the Declaration of Helsinki.
All Doppler values represent the average of three and 10
beats in sinus and atrial fibrillation (AF) rhythm, respectively.
Two-dimensional measurements were performed according to the
recommendations of theAmerican Society of Echocardiography.
12
Mean diastolic transmitral pressure gradient, pressure half-time
and mitral valve area by planimetry were calculated. Mitral
inflow velocities were measured by pulsed-wave Doppler with
the sample volume positioned between the tips of the mitral
leaflets in the apical four-chamber view. Peak early diastolic
velocity (E), peak late diastolic velocity (A), E/A ratio and
deceleration time (DT) were obtained.
Mitral inflow propagation velocity was measured as the
maximum slope of the first aliasing velocity during early filling
from the mitral valve plane to 4 cm distal to the LV cavity in
the apical four-chamber view using colour M-mode Doppler.
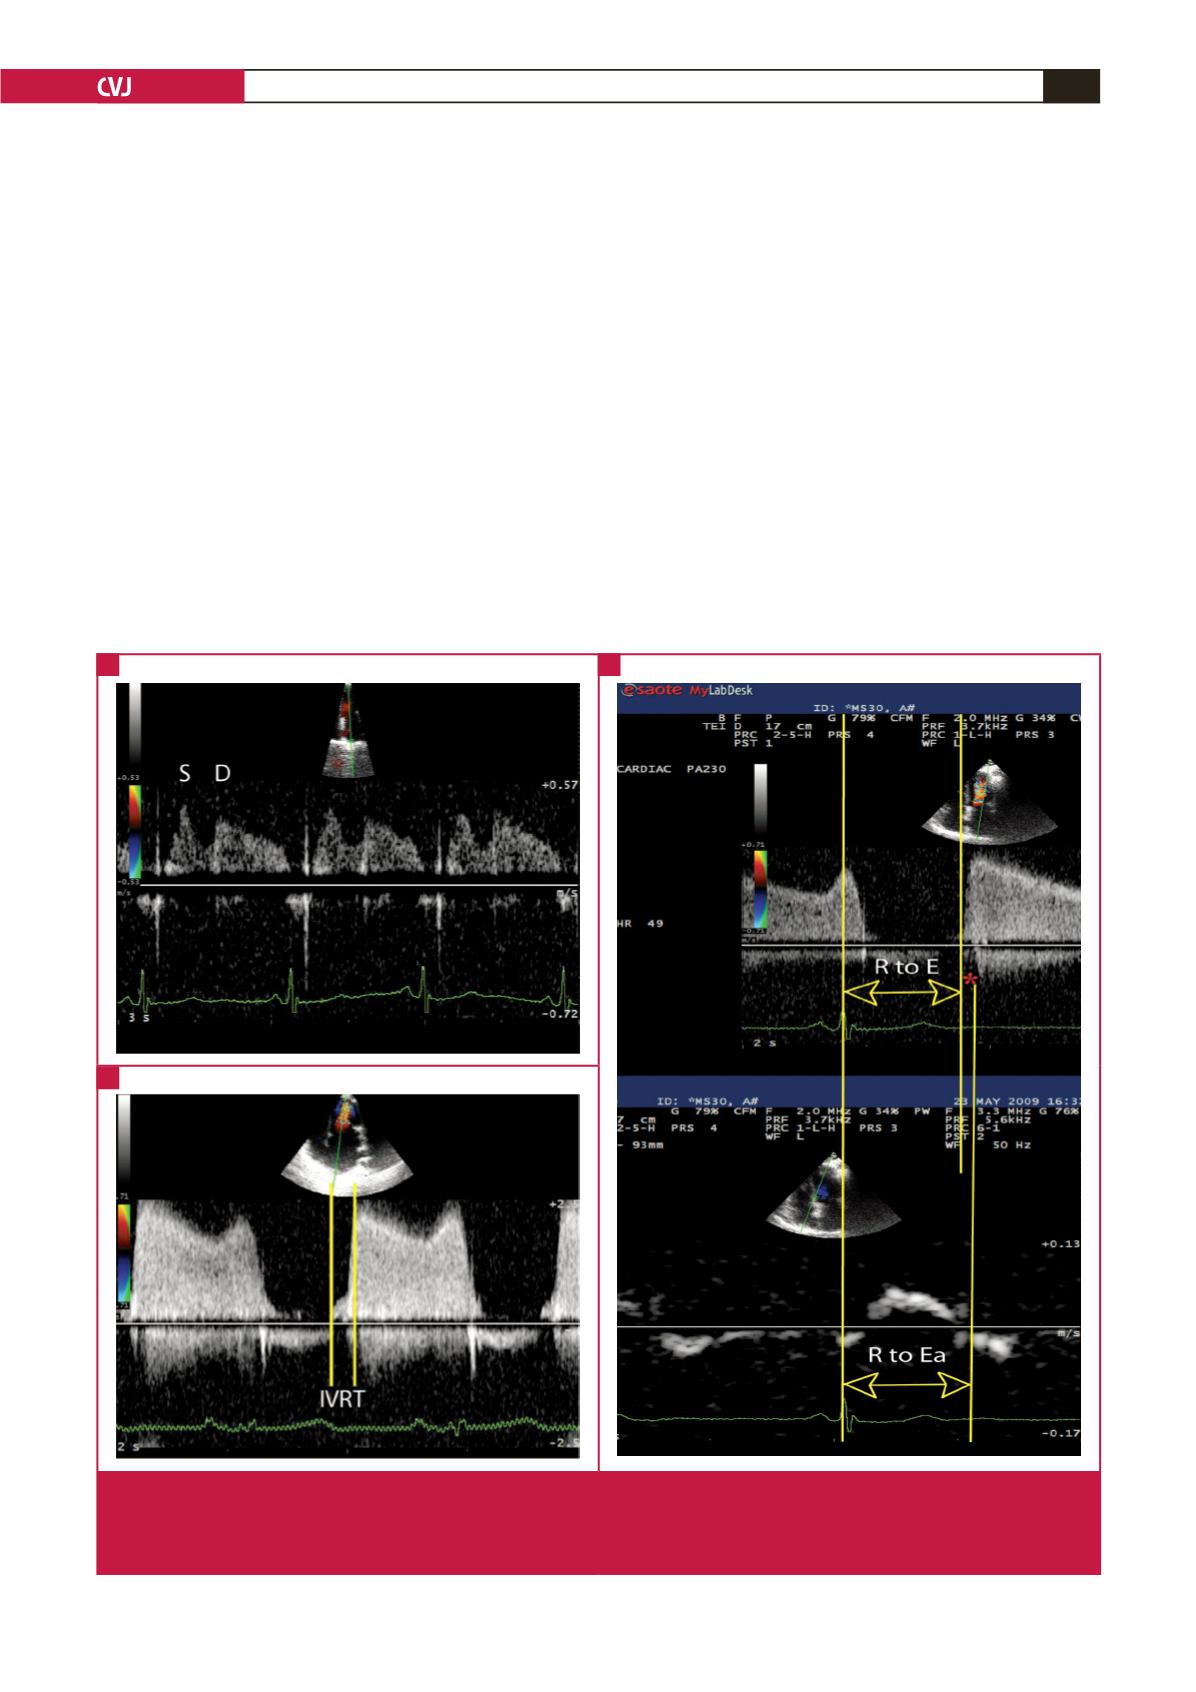
Pulmonary vein systolic flow velocity (PVs) and diastolic flow
Fig. 1.
Doppler signals from patients with mitral stenosis. A. Pulmonary vein flow velocities: S and D. B. IVRT is marked by two
vertical lines between the end of aortic flow and the onset of mitral inflow. C. TE–Ea, which is the difference between two
time intervals: the time interval between the peak of the R wave and the onset of mitral E velocity, as well as the time interval
between the peak of the R wave and the onset of Ea.
A
B
C


