


 13 / 70

CARDIOVASCULAR JOURNAL OF AFRICA • Volume 27, No 5, September/October 2016
AFRICA
283
respectively;
p
=
0.001) and a significantly higher proportion of
men had plaque (30.5 vs 20.2%,
p
<
0.001). The 75th percentiles
for the mean CIMT value of the men and women were 0.92
and 0.88 mm, respectively. In addition, a significantly higher
proportion of men than women had a CIMT value higher than
the 75th percentile or had plaque (42.8 vs 36.5%,
p
=
0.032)
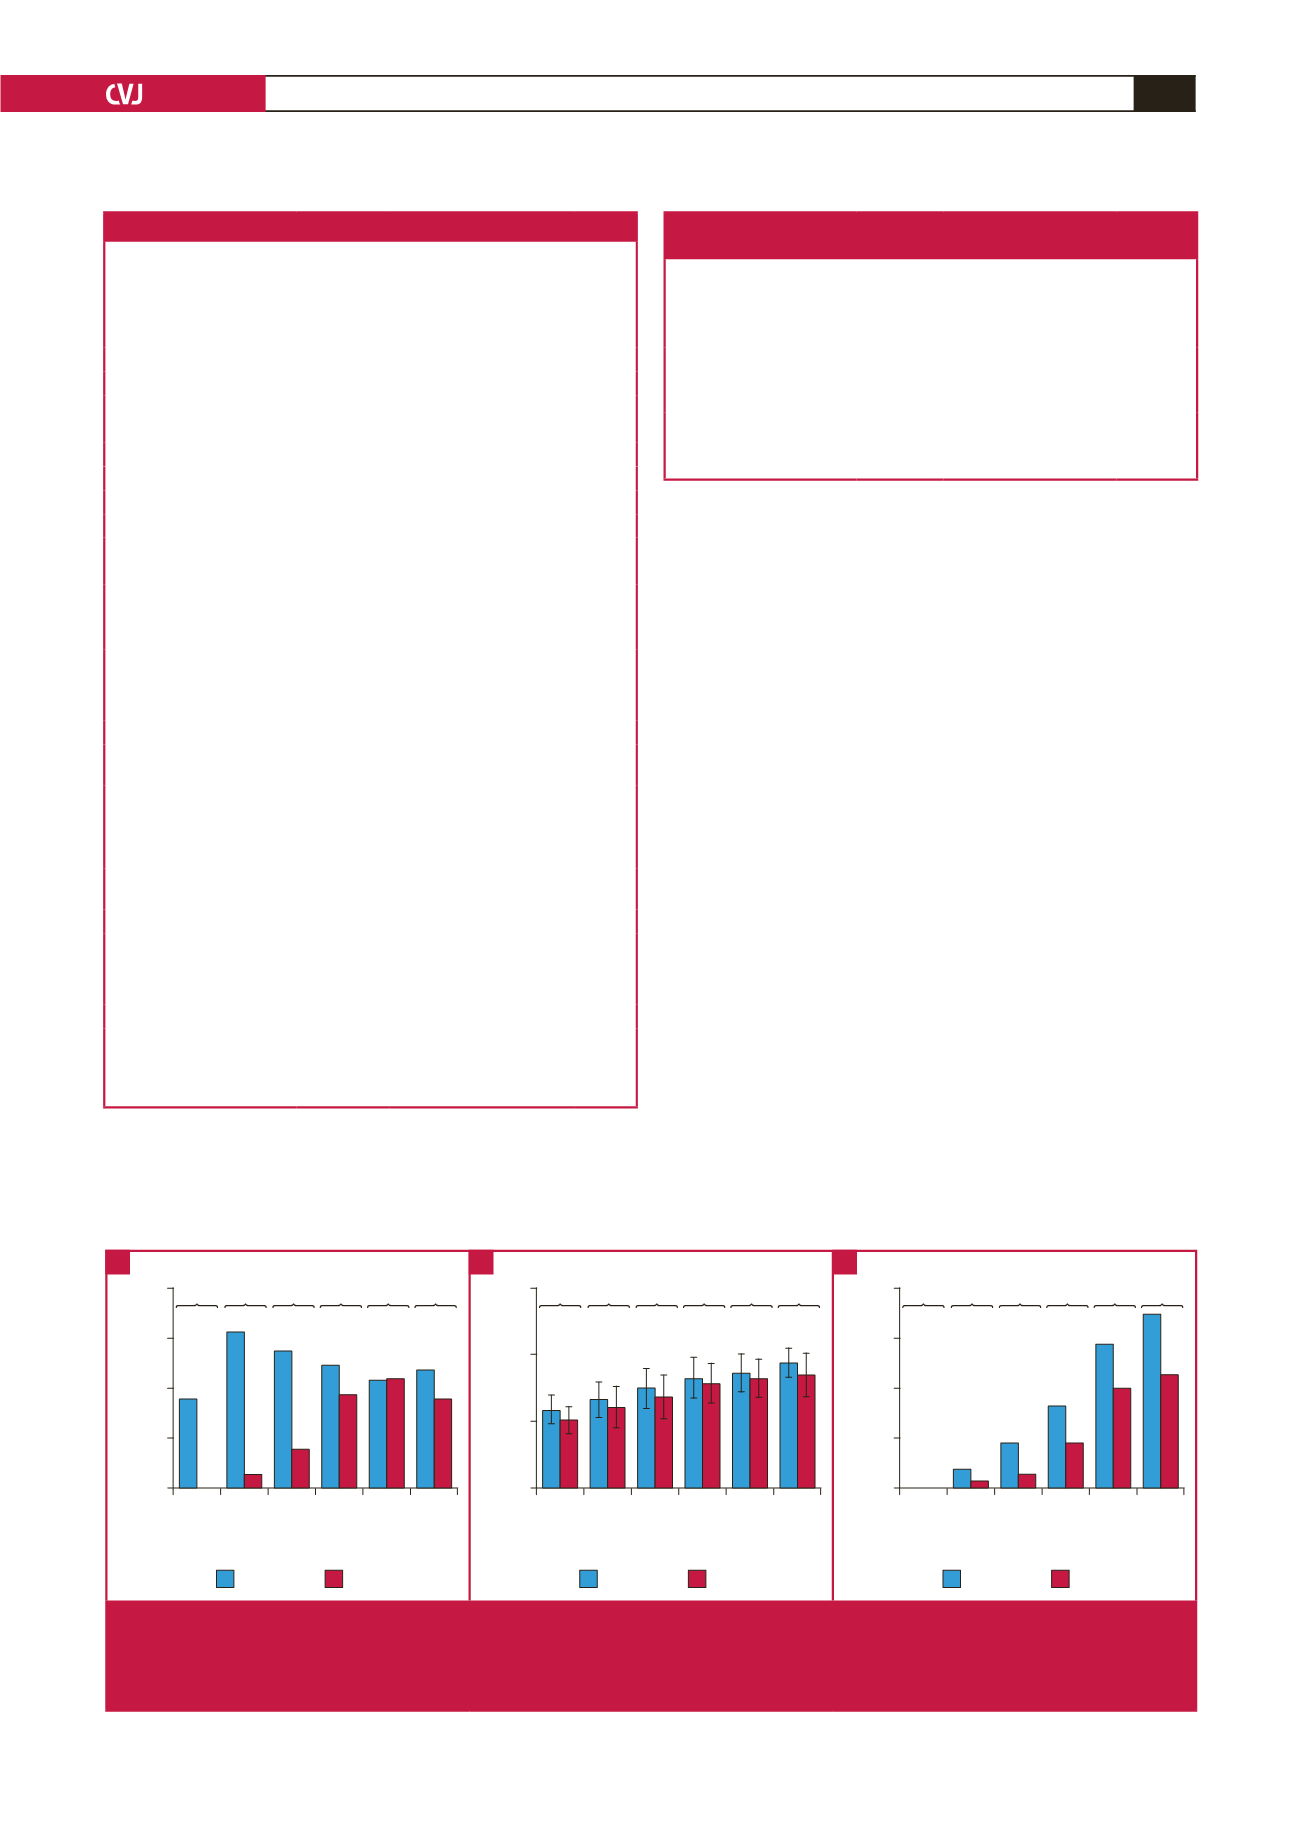
(Table 2). Fig. 2B and C show the mean CIMT values and
prevalence of plaque stratified by gender and age. In all age
groups, a higher proportion of men than women had plaque,
and men had significantly higher CIMT values. Moreover, the
mean CIMT values and rates of plaque deposition showed an
increasing trend with age in both men and women (
p
for trend
<
0.001 in both genders for both CIMT and plaque).
The mean CIMT values and the prevalence of carotid plaque
were significantly higher in both men and women with a
history of hypertension and diabetes, compared to those without
hypertension and diabetes (Table 3). In addition, the mean CIMT
values and plaque rates were significantly higher in women with
a higher waist circumference (
≥
80 cm) than women with lower
waist circumferences (
<
80 cm), in women with dyslipidaemia
than women without dyslipidaemia, and in women with fatty liver
disease than women without fatty livers. Similar differences were
not seen for the men with and without these conditions.
Table 4 shows the results of univariate and multivariate
analysis of factors in relation to subclinical atherosclerosis,
stratified by gender. Univariate analysis found that older age,
history of hypertension, and high fasting glucose levels were
significantly associated with subclinical atherosclerosis in men.
Multivariate analysis found that older age [hazard ratio (HR)
1.11, 95% confidence interval (CI): 1.084–1.130,
p
<
0.001] and
high fasting glucose levels (HR 1.01, 95% CI: 1.001–1.018,
p
=
Table 1. Baseline characteristics of the study patients
All
(
n
=
1121)
Men
(
n
=
630)
Women
(
n
=
491)
p-
value
for
difference
Age (years)
52.9
±
11.5 51.7
±
11.5 54.5
±
11.2
<
0.001
Waist circumference (cm)
81.8
±
9.4 85.5
±
7.9 77.2
±
9.1
<
0.001
Hip circumference (cm)
94.5
±
6.2 95.4
±
6.0 93.3
±
6.3
<
0.001
Waist-to-hip ratio
0.9
±
0.1
0.9
±
0.1
0.8
±
0.1
<
0.001
Height (cm)
163.7
±
9.1 169.7
±
6.2 156.1
±
5.9
<
0.001
Weight (kg)
67.5
±
12.5 73.6
±
11.4 59.6
±
8.9
<
0.001
BMI (kg/m
2
)
25.1
±
3.4 25.5
±
3.2 24.5
±
3.6
<
0.001
SBP (mmHg)
121.8
±
12.8 122.7
±
11.7 120.7
±
14.1 0.011
DBP (mmHg)
74.7
±
9.8 76.3
±
9.3 72.7
±
10.0
<
0.001
Previous history
Hypertension
365 (32.6%) 210 (33.3%) 155 (31.6%)
0.532
Diabetes
155 (13.8%) 104 (16.5%) 51 (10.4%)
0.003
Dyslipidaemia
499 (44.5%) 314 (49.8%) 185 (37.7%)
<
0.001
Fasting glucose (mg/dl)
(mmol/l)
100.3
±
21.2
(5.57
±
1.18)
103.7
±
23.8
(5.76
±
1.32)
96.0
±
16.3
(5.33
±
0.9)
<
0.001
HbA
1c
(%)
5.8
±
0.8
5.8
±
0.9
5.7
±
0.6 0.058
Homocysteine (µmol/l)
11.2
±
4.1 12.5
±
4.5
9.9
±
3.1
<
0.001
Apolipoprotein A-1 (mg/dl) 142.9
±
23.9 137.4
±
22.3 149.2
±
24.2
<
0.001
Apolipotrotein B (mg/dl)
91.0
±
21.3 93.3
±
21.4 88.5
±
21.0 0.001
Total cholesterol (mg/dl)
(mmol/l)
191.8
±
34.4
(4.97
±
0.89)
191.3
±
34.2
(4.95
±
0.89)
192.4
±
34.8
(4.98
±
0.9)
0.588
Triglycerides (mg/dl)
(mmol/l)
138.5
±
89.3
(1.57
±
1.01)
158.6
±
99.6
(1.79
±
1.13)
112.8
±
65.6
(1.27
±
0.74)
<
0.001
LDL-C (mg/dl)
(mmol/l)
112.7
±
29.9
(2.92
±
0.77)
113.4
±
29.8
(2.94
±
0.77)
111.7
±
30.1
(2.89
±
0.78)
0.356
HDL-C (mg/dl)
(mmol/l)
49.3
±
11.6
(1.28
±
0.3)
43.0
±
9.7
(1.11
±
0.25)
53.5
±
12.5
(1.39
±
0.32)
<
0.001
AST (IU/l)
25.5
±
12.2 26.6
±
11.2 24.2
±
13.3 0.001
ALT (IU/l)
25.5
±
18.4 28.6
±
17.7 21.6
±
18.5
<
0.001
AST/ALT ratio
1.2
±
0.4
1.1
±
0.4
1.3
±
0.5
<
0.001
GGT (IU/l)
42.8
±
63.0 57.1
±
78.5 24.3
±
23.7
<
0.001
ALP (IU/l)
130.4
±
86.0 132.9
±
87.6 127.3
±
83.8 0.283
BMI: body mass index; SBP: systolic blood pressure; DBP: diastolic blood pressure;
HbA
1c
: haemoglobin A
1c
; LDL-C: low-density lipoprotein cholesterol; HDL-C: high-
density lipoprotein cholesterol; AST: aspartate aminotransferase; ALT: alanine amino-
transferase; GGT: gamma-glutamyl transpeptidase; ALP: alkaline phosphatase.
Table 2. Gender differences for carotid atherosclerosis and
prevalence of ultrasonographic fatty liver disease
All
(
n
=
1121)
Men
(
n
=
630)
Women
(
n
=
491)
p
-value for
difference
CIMT (mm)
0.78
±
0.17 0.79
±
0.17 0.76
±
0.17 0.001
Presence of plaque (
n
, %)
291 (26.0) 192 (30.5)
99 (20.2)
<
0.001
75th percentile CIMT (mm)
0.90
0.92
0.88
–
CIMT
≥
75th percentile or
presence of plaque (
n
, %)
448 (40.0) 269 (42.8) 179 (36.5)
0.032
Ultrasonographic fatty liver
disease (
n
, %)
472 (42.1) 324 (51.4) 148 (30.1)
<
0.001
CIMT: carotid intima–media thickness.
20–30 31–40 41–50 51–60 61–70 > 70
14 15 104 37 168 109 195 190 113 98 36 42
80
60
40
20
0
Fatty liver disease (%)
Women
Men
p
= 0.017
p
< 0.001
p
< 0.001
p
= 0.019
p
= 0.940
p
= 0.303
Age
Patient
(
n
)
20–30 31–40 41–50 51–60 61–70 > 70
14 15 104 37 168 109 195 190 113 98 36 42
1.5
1.0
0.5
0.0
Carotid IMT (mm)
Women
Men
p
= 0.049
p
= 0.038
p
= 0.001
p
= 0.005
p
= 0.037
p
= 0.006
Age
Patient
(
n
)
20–30 31–40 41–50 51–60 61–70 > 70
14 15 104 37 168 109 195 190 113 98 36 42
80
60
40
20
0
Presence of plaque (%)
Women
Men
p
= .
p
= 0.445
p
= 0.003
p
= 0.001
p
= 0.010
p
= 0.032
Age
Patient
(
n
)
Fig. 2.
Mean carotid intima–media thickness (CIMT), presence of carotid plaque and fatty liver disease, stratified by gender and age.
(A) The prevalence of fatty liver disease was significantly different between men and women under the age of 60 years. (B,
C) The mean CIMT values and prevalence of carotid plaque tended to increase with age in both men and women. Among
all age groups, the men had significantly higher CIMT values and a higher prevalence of plaque than the women.
A
B
C