


 17 / 76

CARDIOVASCULAR JOURNAL OF AFRICA • Volume 28, No 2, March/April 2017
AFRICA
83
of the coronary arteries for absent, poor, good and excellent
CACs, respectively. The grades of the collateral pathways with
obstruction of the middle region were recorded as 16.2, 16.2,
37.8 and 29.7% for absent, poor, good and excellent CACs,
respectively. The grades of the collateral pathways with the
obstruction of the distal region were recorded as 18.8, 18.8, 37.5
and 25% for absent, poor, good and excellent CACs, respectively.
There was no significant difference in the grades of CACs
between the different regions of obstruction (
p
=
0.87) (Table 2).
The mean EF of the patients with proximal, middle and distal
location of atherosclerotic lesions was 63.3, 57.8 and 57.5%,
respectively. This indicated that the best mean EF was recorded
in the patients with proximally located atherosclerotic lesions.
However, analysis of variance (ANOVA) showed that there
was no significant difference in the mean EF calculated for the
different locations of atherosclerotic lesions (
p
=
0.33) (Table 3).
The mean EF of the patients with absent, poor, good and
excellent CACs was calculated as 50.4, 47, 60.5 and 70%,
respectively. ANOVA showed a significant difference in the mean
EF calculated for the different CAC grades in the patients (
p
<
0.001) (Table 4).
A
post hoc
test was performed to determine the significance
of the differences in mean EF calculated for each grade of
CAC. There were significant differences between the mean EF
calculated for patients with absent and excellent CACs (
p
=
0.004), and between the mean EF for poor and excellent CACs
(
p
<
0.001). In addition, there was also a significant difference
between the mean EF calculated for patients with poor and good
CACs (
p
<
0.05).
The mean EF of the patients was also correlated with the
CAC grades. In assessing the correlation between the mean EF
and the CAC grades, a Spearman’s correlation analysis was
performed. This revealed a positive correlation coefficient (
r
=
0.478) that was significant (
p
<
0.001) between the mean EF of
the patients and the CAC grades. This showed that the patients
with better CAC grade had a higher mean EF.
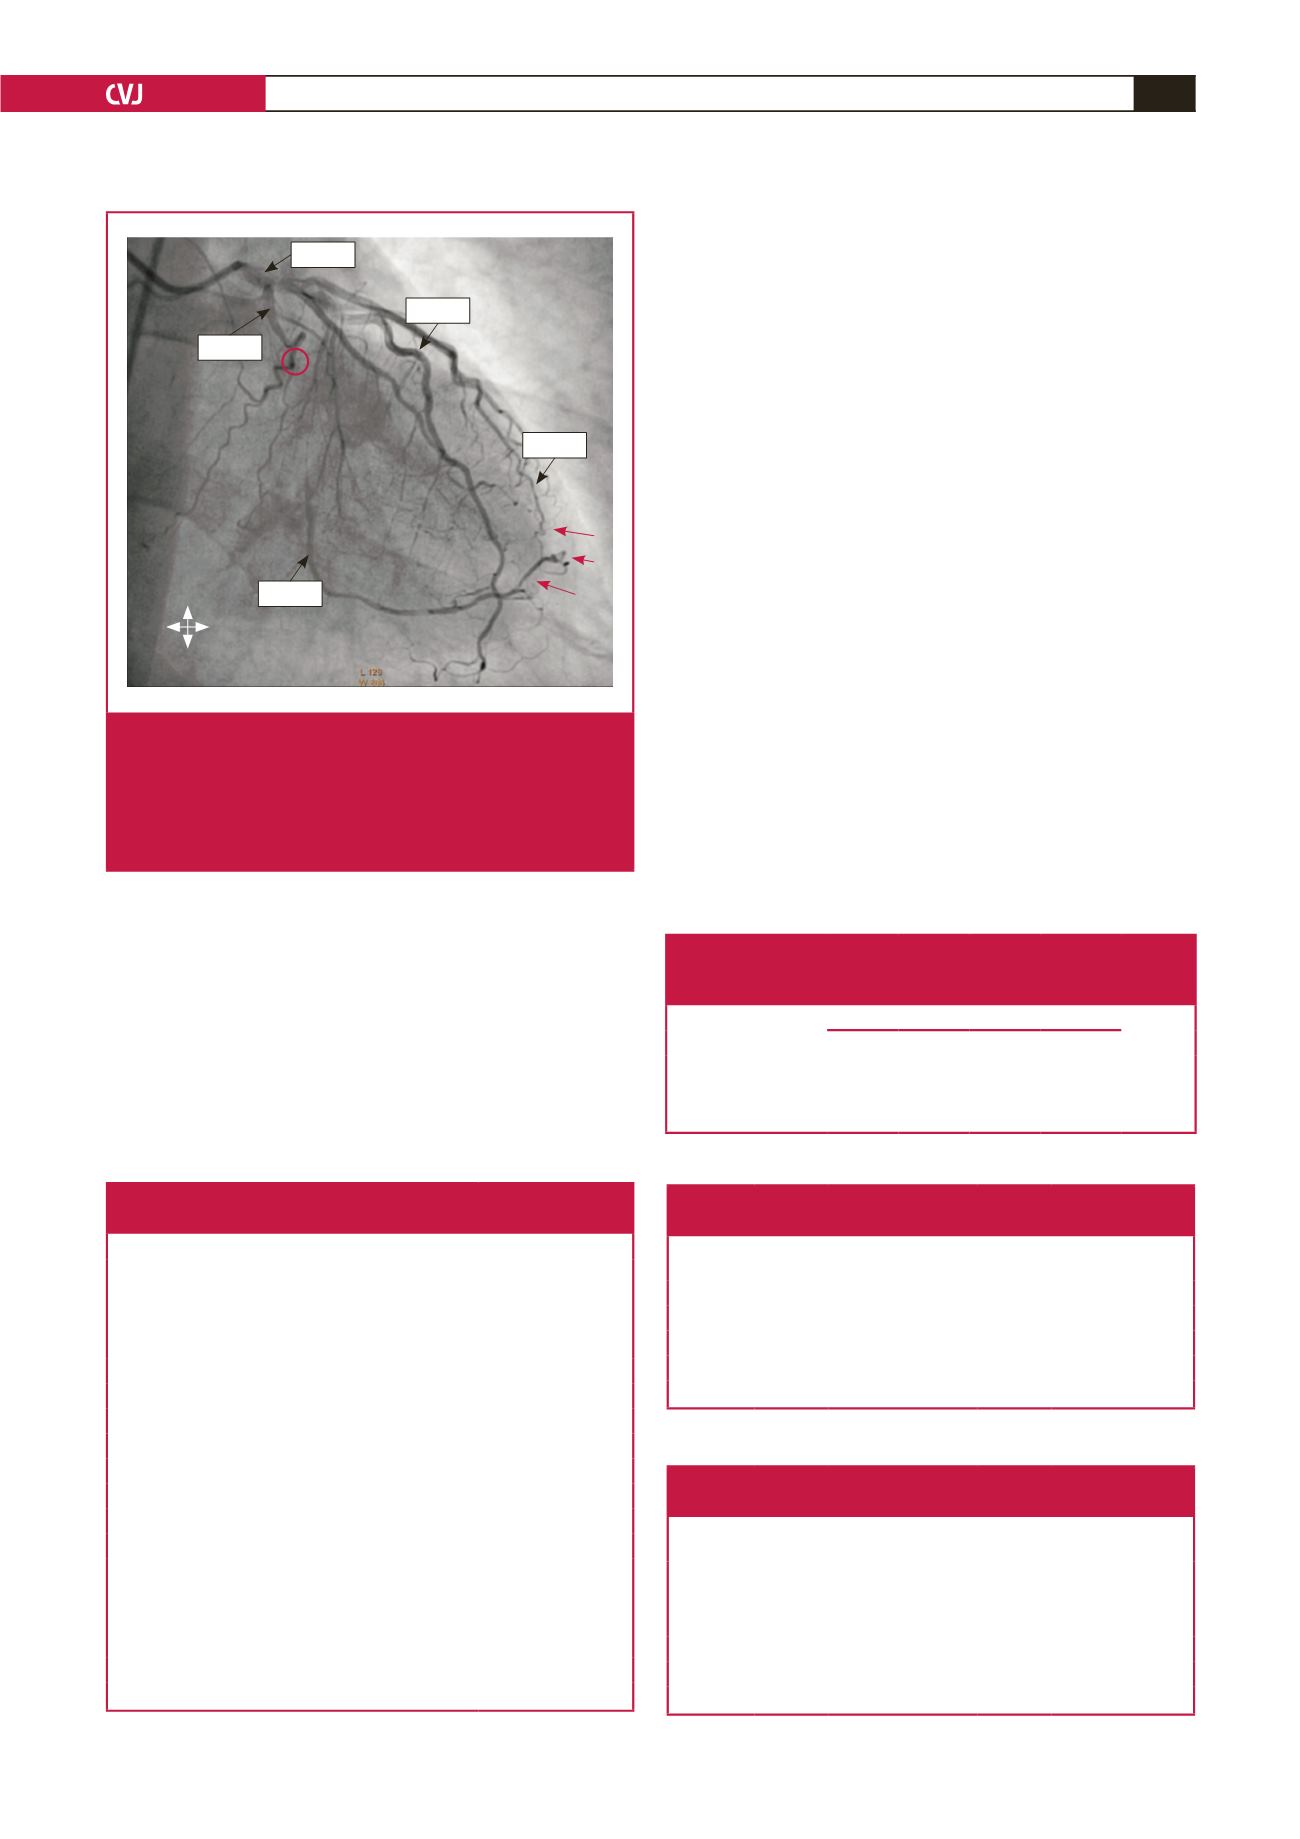
R L
S
I
LAD
D
LCA
Cx
OM
Fig. 3.
Coronary angiogram in the right anterior oblique view
(caudal angulation) showing obstruction of the circum-
flex (Cx) branch (red ring) with the filling of the obtuse
marginal (OM) branch by grade 3 collateral vessel (red
arrows) originating from the diagonal branch of the left
anterior descending (LAD) artery. D, diagonal.
Table 1. Parameters of patients who had
left ventriculography performed
Parameters
Values (
n
=
97)
Mean age, years (SD)
59.1 (8.8)
Mean ejection fraction, % (SD)
60.2 (18.1)
Gender (%)
Female
25.8
Male
74.2
Coronary dominance (%)
Co-dominance
3.1
Left
13.4
Right
83.5
Location of obstruction (%)
Proximal
45.4
Middle
38.1
Distal
16.5
Grading of collateral (%)
Absent
15.4
Poor
15.4
Good
36.9
Excellent
32.3
Table 2. Grading of coronary collateral pathways in the
obstruction of the different regions of the main coronary
arteries in patients who had left ventriculography
Obstructed coronary
arterial region
Grades of collateral vessel (%)
p
-value
Absent Poor
Good Excellent
Proximal
15.9
9.1 34.1
40.9 0.87
Middle
16.2 16.2 37.8
29.7
Distal
18.8 18.8 37.5
25
Table 3. Mean ejection fraction of patients in the different
locations of obstructive atherosclerotic lesions
Lesion
location
Sample
size (
n
)
Mean
(%)
SD
Min
(%)
Max
(%)
p
-value
Proximal
44
63.3
16
29.4 86.5 0.33
Middle
37
57.8
19.8 18.7 85.9
Distal
16
57.5
19.5 19.2 88.4
Total
97
60.2
18.1 18.7 88.4
SD, standard deviation.
Table 4. Mean ejection fraction of patients in the
different coronary collateral grades
Collateral
grade
Sample
size (
n
)
Mean
(%)
SD
Min
(%)
Max
(%)
p
-value
Absent
16
50.4 17.6 19.4 74.3
<
0.001
Poor
13
47
12
29.4 66.3
Good
35
60.5 18.9 18.7 84.7
Excellent
33
70
13.8 29.7 88.4
Total
97
60.2 18.1 18.7 88.4
SD, standard deviation.