CARDIOVASCULAR JOURNAL OF AFRICA • Vol 22, No 1, January/February 2011
AFRICA
21
ing in the Caucasian group. Moreover, HR correlated positively
and significantly with smoking throughout the Caucasian group.
A statistically significant negative correlation existed between
smoking (both chronic and acute) and HDL-C levels before and
after adjustments. TG values increased with chronic exposure to
smoking, evenafter adjusting for age,BMI andWC.Hs-CRP levels
correlated positively and significantly with smoking duration, but
only after adjustment for age and obesity markers (BMI, WC).
On adjustment for age, BMI and WC, almost all correlations
became weak and non-significant. HR remained significant
when correlated with chronic smoking. Hs-CRP correlated
weakly with increased chronic exposure in the whole group of
Africans, while cotinine levels correlated positively with smok-
ing duration in all cases in the African group.
The Caucasian group (Table 5) generally did not show strong
correlations with smoking (both chronic and acute). However,
CO (
r
=
0.13), TPR (
r
=
–0.12) and Cwk (
r
=
0.13) did reflect
statistically significant correlations with cotinine levels in the
whole Caucasian group. Most correlations disappeared after
adjusting for age, BMI and WC. A significant correlation could
also be seen between cotinine levels and the duration of smok-
TABLE 3. COMPARISON BETWEEN CAUCASIAN
SMOKERSAND NON-SMOKERS
Variable
Caucasian non-smokers
(
n
=
303)
Caucasian smokers
(
n
=
53)
p
-value
Age (years)
41.4
±
0.74 (39.9; 42.8) 35.0
±
1.67 (31.6; 38.2)
≤
0.001
Gender (men/women)
127/191
34/20
Height (m)
1.71
±
0.01 (1.71; 1.73) 1.73
±
0.01 (1.70; 1.75) 0.444
Weight (kg)
82.0
±
1.12 (79.8; 84.1) 84.1
±
2.75 (78.6; 89.6) 0.453
BMI (kg/m
2
)
27.7
±
0.34 (27.0; 28.4) 28.0
±
0.81 (26.4; 29.7) 0.686
WC (cm)
87.2
±
0.85 (85.5; 88.9) 89.0
±
2.19 (84.6; 93.4) 0.410
SBP (mmHg)
119
±
0.93 (118; 121) 119
±
1.98 (115; 123)
0.909
DBP (mmHg)
78
±
0.56 (77.1; 79.3) 79
±
1.42 (75.6; 81.3)
0.863
HR (beats/min)
67.0
±
0.53 (66.0; 68.1) 71.0
±
1.24 (68.0; 73.0) 0.014
SV (ml)
90.3
±
1.36 (87.6; 93.0) 94.1
±
3.43 (87.3; 101)
0.283
CO (l/min)
6.04
±
0.10 (5.85; 6.24) 6.57
±
0.28 (6.01; 7.14) 0.046
TPR (mmHg.s/ml) 1.07
±
0.02 (1.03; 1.11) 0.96
±
0.04 (0.89; 1.04) 0.027
Cwk (ml/mmHg)
2.07
±
0.03 (2.00; 2.13) 2.33
±
0.08 (2.17; 2.48) 0.002
C-R PWV (m/s)
7.62
±
0.08 (7.46; 7.78) 7.62
±
0.14 (7.34; 7.89) 0.982
C-P PWV (m/s)
7.82
±
0.07 (7.69; 7.95) 7.82
±
0.15 (7.52; 8.12) 0.983
HDL-C (mmol/l)
1.42
±
0.02 (1.37; 1.47) 1.22
±
0.06 (1.10; 1.33)
≤
0.001
LDL-C (mmol/l)
3.76
±
0.07 (3.62; 3.90) 3.80
±
0.16 (3.47; 4.13) 0.837
TG (mmol/l)
1.45
±
0.01 (0.36; 0.39) 1.54
±
0.02 (0.39; 0.47) 0.005
hs-CRP (mg/l)
1.63
±
0.02 (0.45; 0.53) 1.80
±
0.05 (0.49; 0.69) 0.060
Cotinine (ng/ml)
10.4
±
0.78 (8.89; 11.9) 231
±
18.5 (194; 268)
≤
0.001
Comparison after adjustment for age, gender, BMI and WC
SBP (mmHg)
119
±
0.74 (118; 121) 120
±
1.84 (116; 123)
0.970
DBP (mmHg)
78
±
0.46 (77.1; 78.9)
79
±
1.14 (77.1; 81.6)
0.776
HR (beats/min)
67.0
±
0.52 (66.0; 68.0) 71.0
±
1.29 (68.2; 73.2) 0.014
SV (ml)
91.2
±
1.04 (89.1; 93.2) 89.3
±
2.59 (84.2; 94.4) 0.165
CO (l/min)
6.11
±
0.08 (5.95; 6.26) 6.26
±
0.19 (5.87; 6.64)
0.012
TPR (mmHg.s/ml) 1.06
±
0.02 (1.03; 1.09) 1.04
±
0.04 (0.96; 1.12)
0.011
Cwk (ml/mmHg)
2.11
±
0.02 (2.08; 2.14) 2.05
±
0.04 (1.97; 2.13)
≤
0.001
C-R PWV (m/s)
7.62
±
0.07 (7.48; 7.76) 7.65
±
0.18 (7.29; 8.01) 0.423
C-P PWV (m/s)
7.79
±
0.05 (7.69; 7.90) 7.98
±
0.14 (7.71; 8.25) 0.423
HDL-C (mmol/l)
1.41
±
0.02 (1.37; 1.45) 1.29
±
0.05 (1.20; 1.39)
≤
0.001
LDL-C (mmol/l)
3.75
±
0.07 (3.62; 3.88) 3.89
±
0.17 (3.57; 4.22) 0.859
TG (mmol/l)
1.45
±
0.01 (0.36; 0.38) 1.54
±
0.02 (0.40; 0.47) 0.002
hs-CRP (mg/l)
1.62
±
0.02 (0.45; 0.52) 1.84
±
0.04 (0.52; 0.70) 0.029
Cotinine (ng/ml)
10.2
±
3.06 (4.23; 16.3) 232
±
7.47 (218; 247)
≤
0.001
Values are expressed as the mean
±
standard error (95% CI). The mean values
for TG and hs-CRP were logarithmically transformed and geometric means used.
PWV was also adjusted for MAP. BMI: body mass index; WC: waist circumfer-
ence; SBP: systolic blood pressure; DBP: diastolic blood pressure; SV: stroke
volume; CO: cardiac output; TPR: total peripheral resistance; Cwk: Windkessel
compliance; C-R PWV: carotid-radialis pulse wave velocity; C-P PWV: carotid-
dorsalis pedis pulse wave velocity; HDL-C: high-density lipoprotein cholesterol;
LDL-C: low-density lipoprotein cholesterol; TG: triglycerides; hs-CRP: high-
sensitivity C-reactive protein.
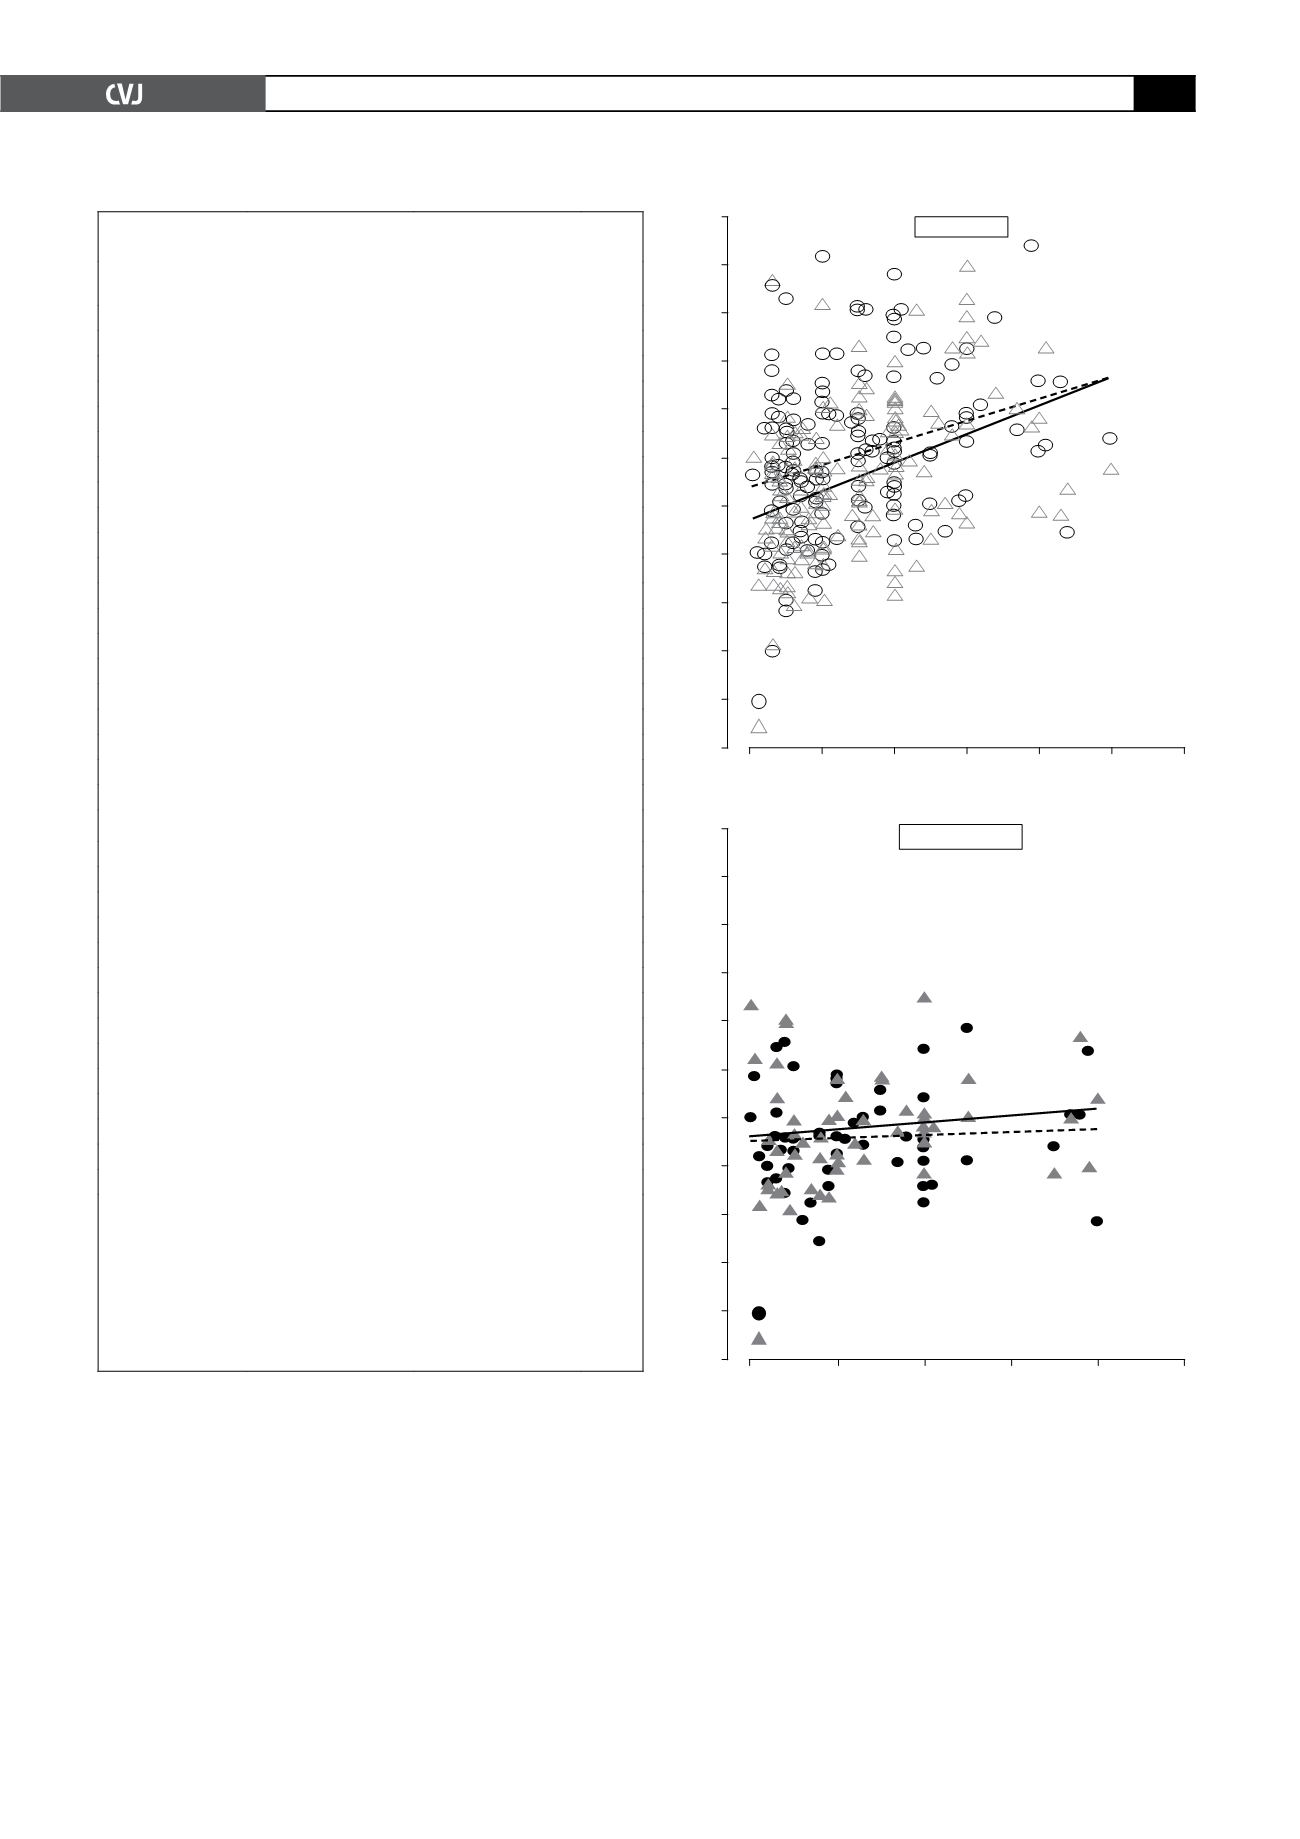
Fig. 1. The relationship between duration of smoking and
arterial stiffness in Africans and Caucasians. C-R PWV:
carotid-radialis pulse wave velocity; C-P PWV: carotid-
dorsalis pedis pulse wave velocity.
14
13
12
11
10
9
8
7
6
5
4
3
Pulse wave velocity (m/s)
Africans
0
10
20
30
40
50
60
C–P PWV
r
=
0.41;
p
<
0.001
C–R PWV
r
=
0.36;
p
<
0.001
C–P PWV
C–R PWV
Smoking duration (years)
Smoking duration (years)
0
10
20
30
40
50
Caucasians
C–P PWV
r
=
0.03;
p
<
0.59
C–R PWV
r
=
0.01;
p
<
0.87
C–P PWV
C–R PWV
14
13
12
11
10
9
8
7
6
5
4
3
Pulse wave velocity (m/s)


