CARDIOVASCULAR JOURNAL OF AFRICA • Vol 24, No 6, July 2013
226
AFRICA
Windows version 17.0 (Statistical Package for the Social Sciences
Inc, Chicago, IL, USA). Continuous variables were expressed as
mean values
±
standard deviation (SD). Categorical variables
were expressed as number and percentages. Demographic
characteristics and outcomes of the groups were compared
using independent samples
t
-test for continuous variables, and
chi-square and Fisher’s exact tests for categorical variables.
Statistical significance was set as
p
<
0.05.
The changes in cytokine levels, lactate and
∆
A–aO
2
within
the groups were compared using the Friedman test. In cases of
significant difference, Wilcoxon signed ranks test was used to
define the groups that made the difference. Comparison between
the groups was done using the Mann-Whitney
U
-test.
Results
Fifty-nine patients were included in the study. There were 29
patients in the NV group and 30 in the V group. The mean ages
of the patients were 62.48
±
6.42 in the NV group and 59.40
±
11.10 in the V group (
p
=
0.19). The pre-operative demographic
data and intra-operative characteristics of the patients are given
in Table 1. The groups were comparable.
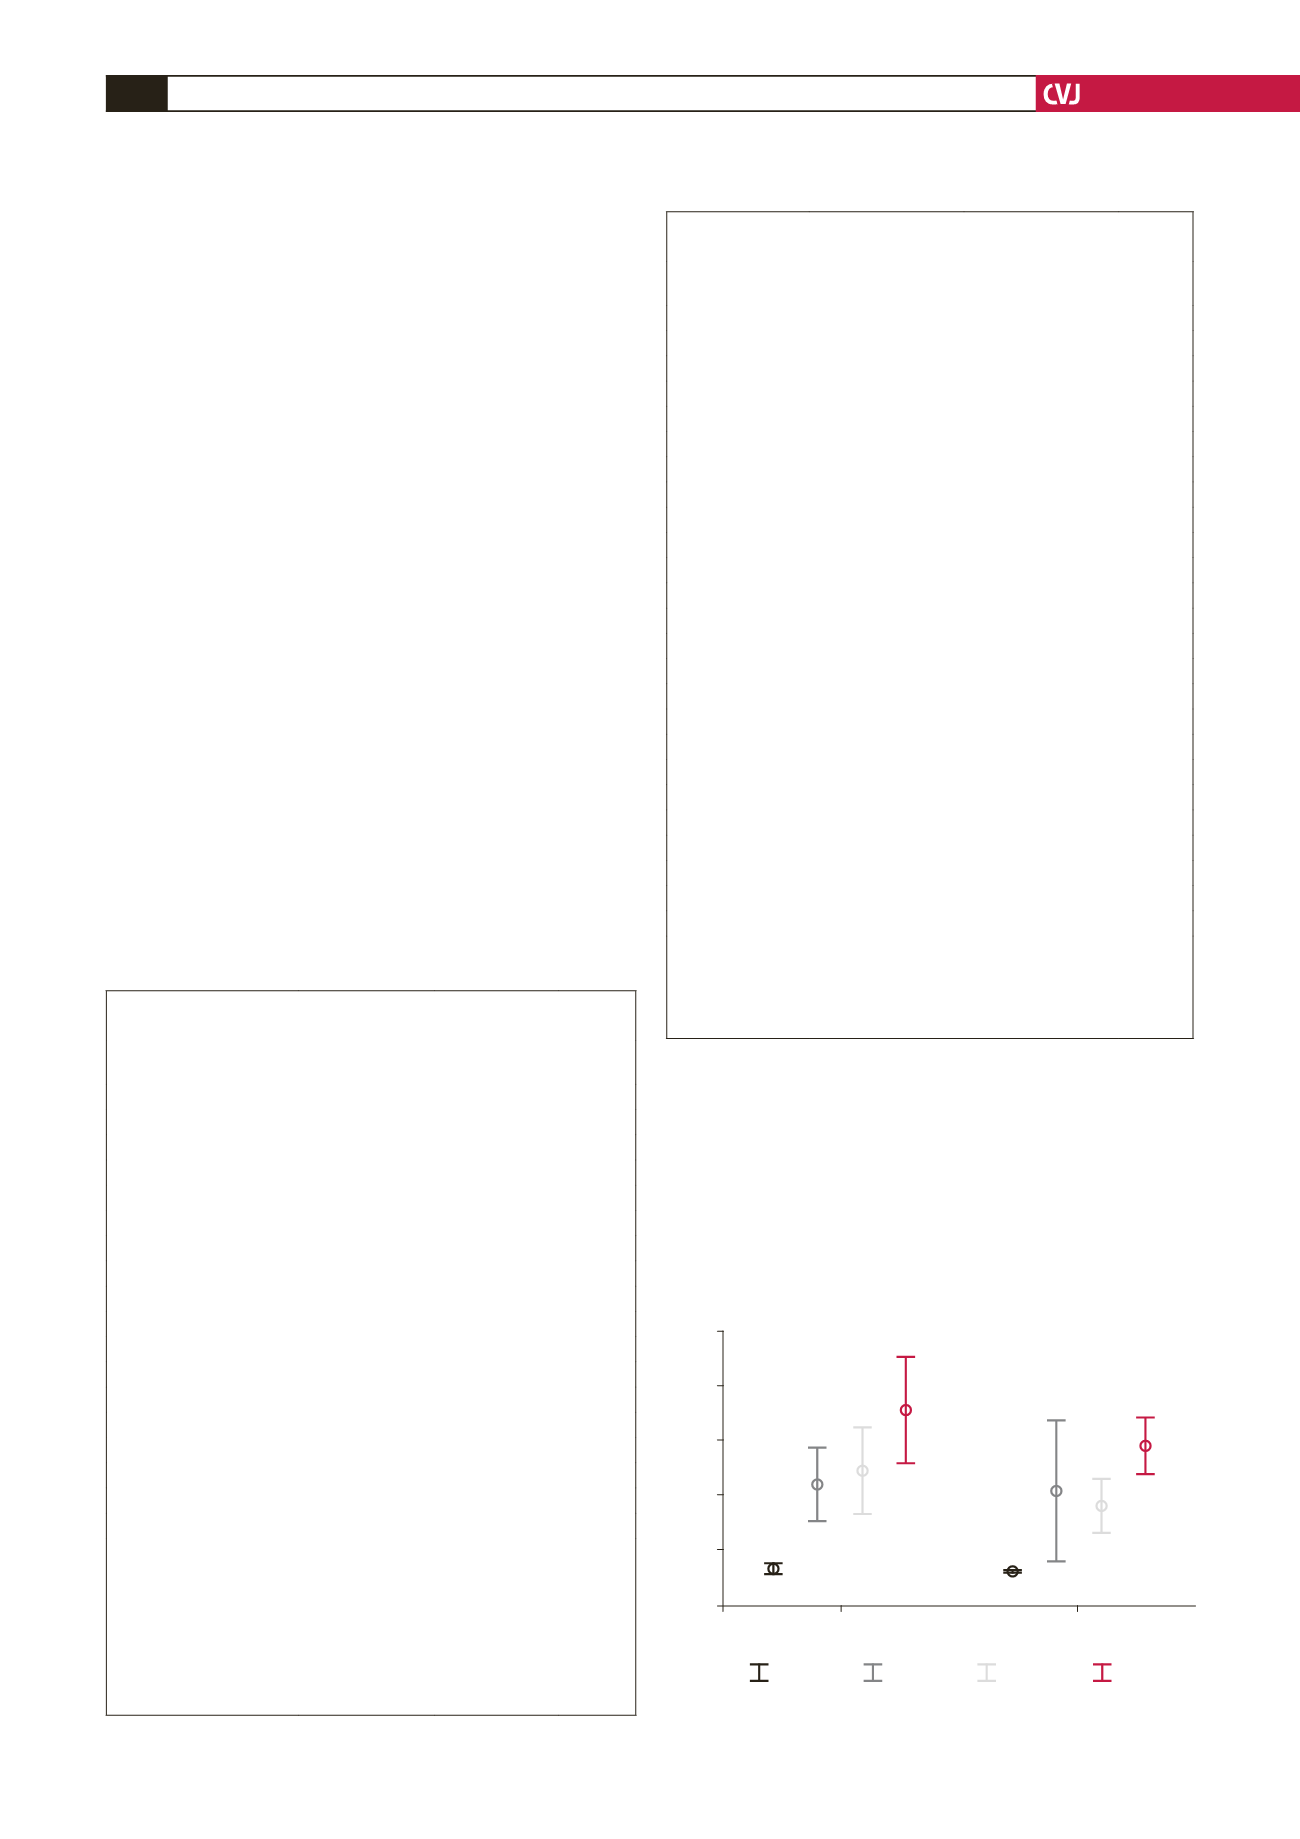
IL-6 levels were increased after induction of anaesthesia
in both groups and remained higher than baseline levels six
hours after discontinuation of CPB. When the two groups
were compared, only IL-6 levels were higher immediately after
discontinuation of CPB in the NV group than in the V group (
p
=
0.049) (Table 2, Fig. 1).
Interleukin-8 levels were increased in the NV group, they
peaked one hour after discontinuation of CPB and decreased
at six hours to baseline levels (
p
=
0.005). In the V group, IL-8
levels increased, peaked immediately after discontinuation of
CPB, decreased at one hour and increased again at six hours,
but the change in IL-8 concentrations in this group was not
significant (
p
=
0.99). When the two groups were compared,
there was no statistically significant difference at any time period
(Table 2, Fig. 2).
IL-10 levels were increased in the NV group, peaked
immediately after discontinuation of CPB, decreased soon after
TABLE 1. PRE-OPERATIVE DEMOGRAPHIC
CHARACTERISTICS OF PATIENTS
Variable
NV group (
n
=
29)
mean
±
SD
V group (
n
=
30)
mean
±
SD
p
-value*
Age
62.48
±
6.42
59.40
±
11.10
0.19
BMI (kg/m
2
)
32.51
±
12.22
29.17
±
3.44
0.15
LVEF (%)
52.48
±
11.77 52.57
±
10.14
0.97
Cross-clamp time (min)
54.66
±
13.97 54.67
±
13.11
0.99
CPB time (min)
83.41
±
22.72
80.83
±
22.23
0.66
No of grafts
3.21
±
0.77
3.03
±
0.85
0.41
n
(%)
n
(%)
p
-value**
Male
23 (79.3)
26 (86.7)
0.45
Current/ex-smoker
22 (75.9)
22 (73.3)
0.82
Diabetes mellitus
16 (55.2)
12 (40.0)
0.24
Insulin dependent
a
7 (46.7)
8 (58.3)
0.22
Hypertension
22 (75.9)
16 (53.3)
0.07
Dyslipidaemia
23 (79.3)
21 (70)
0.41
Statin therapy
b
14 (60.9)
16 (76.2)
0.27
Pre-operative
β
-blocker use
17 (58.6)
12 (40.0)
0.15
Peripheral arterial diseasec
2 (6.9)
0
0.23***
Stroke
2 (6.9)
1(3.3)
0.49***
Carotid disease
d
0
2 (6.7)
0.61***
SD: standard deviation, NV: non-ventilated, V: ventilated, BMI: body mass
index, LVEF: left ventricular ejection fraction, CPB: cardiopulmonary bypass.
*Independent samples
t
-test, **Chi-square test, ***Fisher’s exact test.
a
The percentage values were calculated in diabetic patients.
b
The percentage values were calculated in dyslipidaemic patients.
c
History of therapeutic vascular intervention, history of claudication, aniography/
non-invasive proven peripheral arterial disease.
d
History of carotid intervention or angiographic/non-invasive proven
>
40%
stenosis of either carotid artery.
TABLE 2. COMPARISON OF TWO GROUPSWITH CYTOKINE
LEVELSANDALVEOLAR–ARTERIAL OXYGEN GRADIENT
Variable
NV group (
n
=
29)
mean
±
SD
V group (
n
=
30)
mean
±
SD
p
-value*
IL-6
0
(pg/ml)
8.28
±
1.06
8.03
±
0.18
0.51
IL-6
1
(pg/ml)
16.0
±
9.04
15.37
±
17.21
0.049
IL-6
2
(pg/ml)
17.31
±
10.34
13.97
±
6.57
0.22
IL-6
3
(pg/ml)
22.83
±
12.91
19.50
±
6.88
0.38
p
-value**
<
0.001
<
0.001
IL-8
0
(pg/ml)
24.86
±
48.30
25.03
±
25.53
0.14
IL-8
1
(pg/ml)
30.79
±
44.50
26.07
±
30.35
0.85
IL-8
2
(pg/ml)
31.72
±
44.71
21.67
±
21.18
0.62
IL-8
3
(pg/ml)
20.34
±
29.47
24.20
±
23.63
0.33
p
-value**
0.005
0.997
IL-10
0
(pg/ml)
15.30
±
7.31
15.58
±
9.36
0.87
IL-10
1
(pg/ml)
142.03
±
55.20
85.74
±
61.65
0.002
IL-10
2
(pg/ml)
120.00
±
41.73
108.45
±
68.13
0.62
IL-10
3
(pg/ml)
24.20
±
24.98
26.16
±
37.41
0.98
p
-value**
<
0.001
<
0.001
Lactate
0
(mmol/l)
1.56
±
0.73
1.38
±
0.47
0.55
Lactate
1
(mmol/l)
4.07
±
1.68
2.95
±
1.49
0.003
Lactate
2
(mmol/l)
4.10
±
1.90
4.04
±
4.04
0.21
Lactate
3
(mmol/l)
3.96
±
2.16
4.10
±
1.37
0.34
p
-value**
<
0.001
<
0.001
∆
A–aO
2(0)
(kPa)
20.60
±
6.16
11.84
±
5.39
<
0.001
∆
A–aO
2(1)
( kPa)
24.91
±
3.98
14.15
±
5.77
<
0.001
∆
A–aO
2(2)
(kPa)
26.47
±
5.13
19.54
±
4.05
<
0.001
∆
A–aO
2(3)
(kPa)
18.95
±
7.59
17.19
±
6.77
0.31
p
-value**
<
0.001
<
0.001
SD: standard deviation, NV: non-ventilated, V: ventilated, IL: interleukin,
∆
A–aO
2
: alveolar–arterial oxygen gradient.
*Mann-Whitney U-test, **Friedman test.
0
After induction of anaesthesia,
1
Immediately after discontinuation of CPB,
2
One
hour after discontinuation of CPB,
3
Six hours after discontinuation of CPB.
Fig. 1. Serum IL-6 levels.
30
25
20
15
10
5
NV
V
Group
95% CI (pg/ml)
IL-6
0
IL-6
2
IL-6
1
IL-6
3


