CARDIOVASCULAR JOURNAL OF AFRICA • Volume 25, No 2, March/April 2014
70
AFRICA
viability and decreased myocardial injury, therefore having a
beneficial effect on contractile performance postoperatively.
Nikas
et al
.
4
reported that topical cooling had no effect on
myocardial temperature; however, it increased postoperative
complications such as diaphragmatic injury, arrhythmias and
their consequences by hypothermic myocyte injury. They
believed topical hypothermia to be detrimental in cardiac
surgical modalities.
4
After their study, topical cooling become
controversial in many cardiac surgery centres.
Minatoya
et al
.
5
compared cardiac normothermia under
normothermic CPB with cardiac hypothermia (with topical
cooling) under hypothermic CPB.They reported that hypothermia
had more deleterious effects on cardiac myocytes and cardiac
contractility. They assessed cardiac enzymes, echocardiography
and ECG as an indirect indicator of myocardial damage.
5
In our
study we used pre-operative, intra-operative and postoperative
levels of cardiac enzymes and complement factors as an
indirect marker of the condition of cardiac myocytes and local
myocardial inflammation.
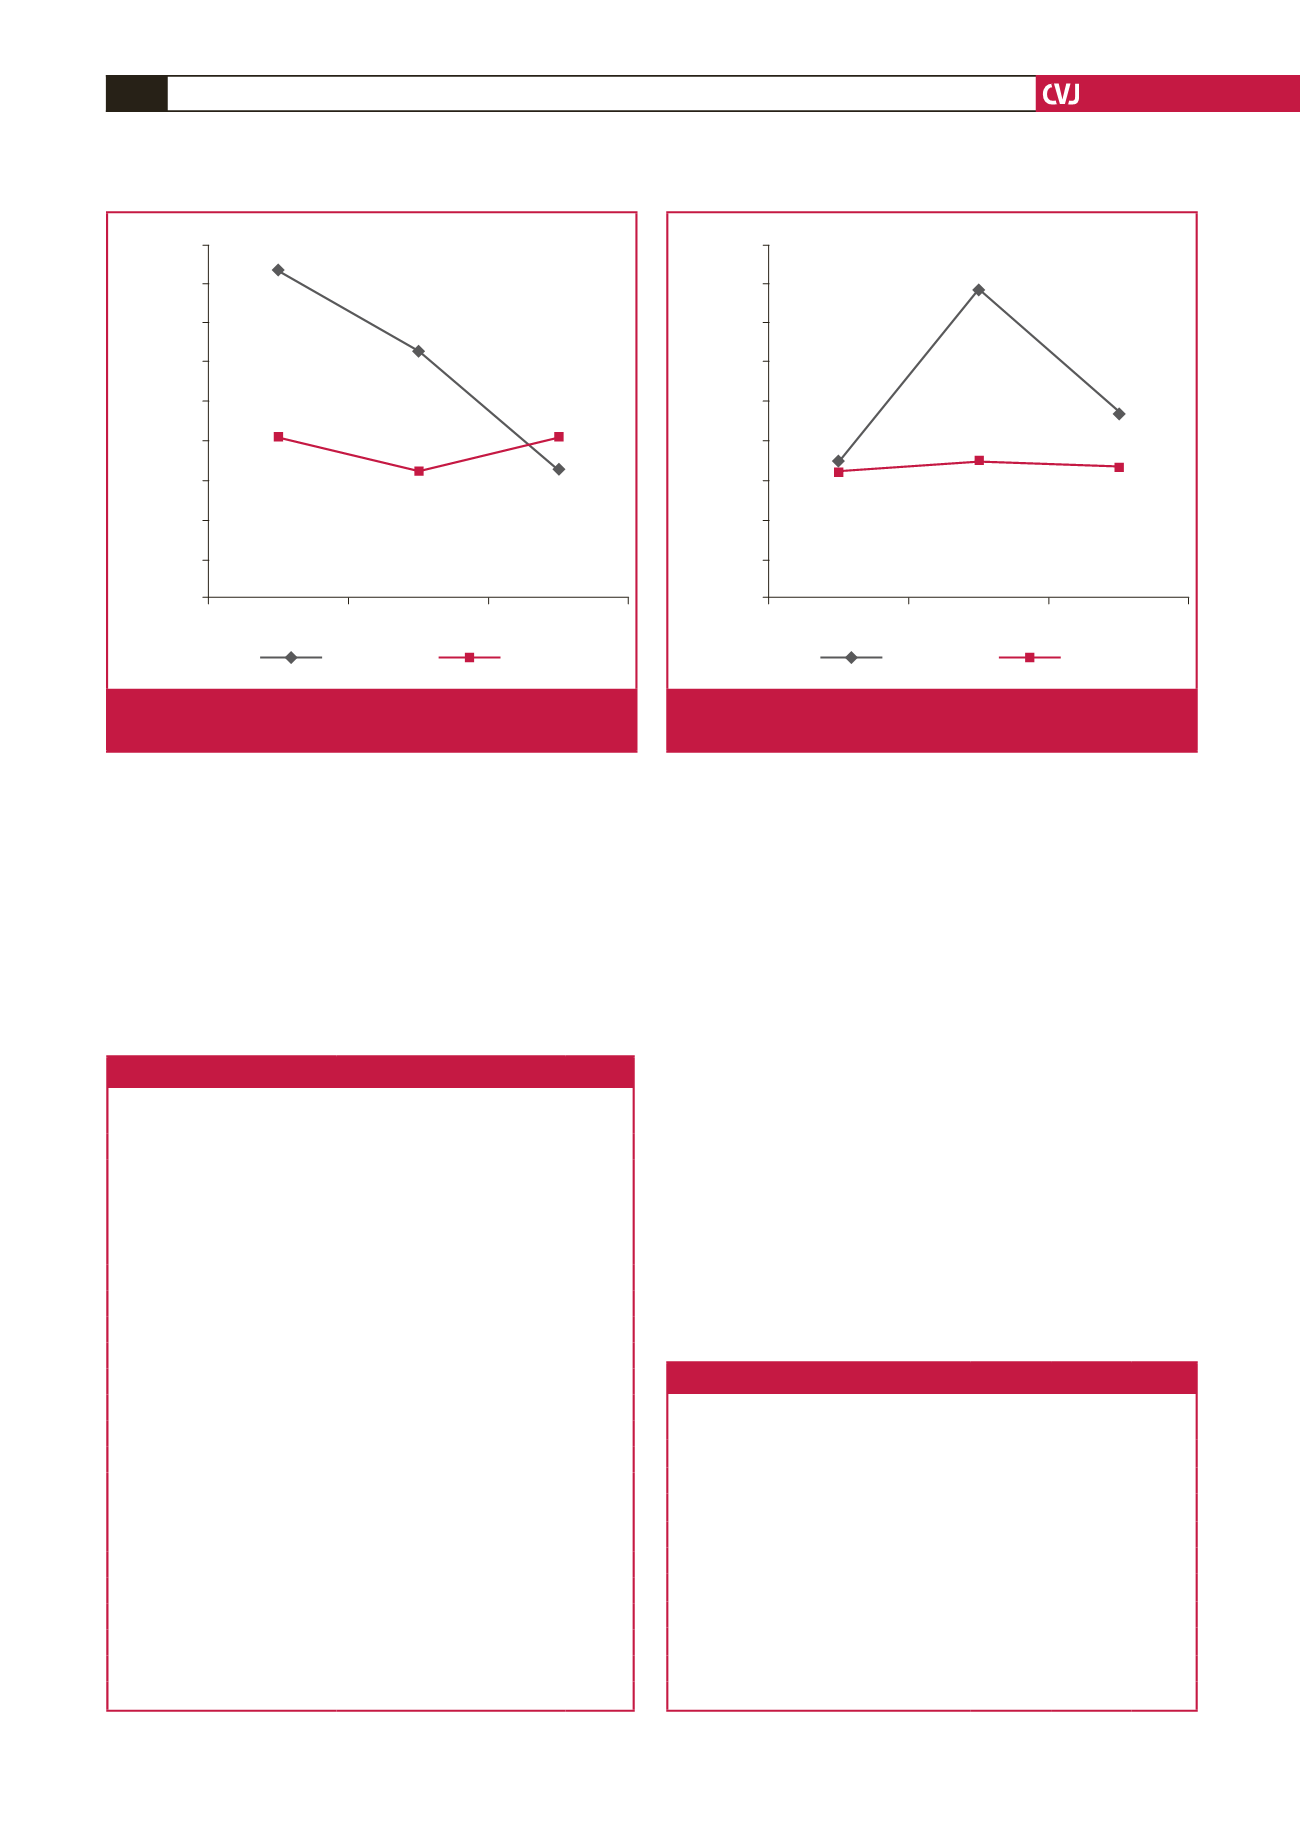
Blood samples
There were no significant differences between the groups
with regard to blood samples, whereas we found a significant
difference in time-dependent changes in C3 and TNF-
α
levels.
C3 levels rapidly decreased during the ischaemic and reperfusion
periods in group I. In group II, C3 levels decreased minimally
in the ischaemic period, and returned to almost baseline values
during the reperfusion period (Fig. 1).
Normally, after placing the ACC, ischaemia and the
inflammatory period begins, and therefore complement activation
0.6500
0.6400
0.6300
0.6200
0.6100
0.6000
0.5900
0.5800
0.5700
0.5600
Basal
Ischaemia Reperfusion
C3 (g/l)
0.643
±
0.119
0.601
±
0.979
0.623
±
0.104
0.592
±
0.116
0.601
±
0.876
0.593
±
0.817
Group I
Group II
p
<
0.05
Fig. 1.
Blood samples results and time-dependent changes
in C3 levels.
9.800
9.600
9.400
9.200
9.000
8.800
8.600
8.400
8.200
8.000
Basal
Ischaemia Reperfusion
TNF-
α
(pg/ml)
8.566
±
0.642
8.561
±
0.722
9.556
±
0.879
8.577
±
0.676
8.846
±
0.602
8.544
±
0.48
Group I
Group II
p
<
0.001
Fig. 2.
Blood samples results and time-dependent changes
in TNF-
a
levels.
Table 4. Comparison of the patients’ data.
Group I
(
n
=
25)
Group II
(
n
=
25)
p-
value
Positive inotropes
Adrenaline (
n
)
14
11
>
0.05
Dopamine (
n
)
1
0
>
0.05
Dobutamine (
n
)
2
0
>
0.05
ICU
Intubation time (h)
13.06
±
3.66 13.28
±
2.37
>
0.05
ICU stay (h)
29.4
±
12.28 30.24
±
20.99
>
0.05
Drainage and transfusions
Total drainage (ml)
1022
±
507.12 1004
±
473.33
>
0.05
Total transfusion (ml)
764
±
462.7 848
±
476.20
>
0.05
ECG and echocardiography
Significant ECG changes (
n
)
0
0
>
0.05
Significant EF changes (
n
)
1
1
>
0.05
Wall motion disorder (
n
)
2
0
>
0.05
Aneurysm formation (
n
)
0
0
>
0.05
Valve dysfunction (
n
)
0
0
>
0.05
Other complications
Peri-operative MI (
n
)
0
0
>
0.05
Pacemaker need (
n
)
1
0
>
0.05
Low cardiac output (
n
)
1
0
>
0.05
Death (
n
)
1
0
>
0.05
Total hospital stay (day)
8.72
±
2.42 8.20
±
1.35
>
0.05
Table 5. Other postoperative data.
Group I
(
n
=
25)
Group II
(
n
=
25)
p-
value
Spontaneous sinus rhythm restoration (
n
)
8
20
<
0.01
Dysrhythmias
Atrial fibrillation (
n
)
6
1
<
0.05
Ventricular faibrillation (
n
)
1
0
>
0.05
Other (
n
)
1
1
>
0.05
IABP require (
n
)
4
0
<
0.05
Diaphragmatic complications
Diaphragmatic elevation (
n
)
7
0
<
0.01
Partial pericardiotomy (
n
)
11
13
>
0.05
Pleural effusion (
n
)
3
2
>
0.05


