CARDIOVASCULAR JOURNAL OF AFRICA • Volume 25, No 2, March/April 2014
e2
AFRICA
Echocardiography showed no pericardial effusion. Despite
these findings, the operation was terminated. Elevated ST
segment in leads V
1
to V
3
gradually decreased to normal after
approximately 20 minutes (Fig. 4B). Echocardiography after one
and 24 hours still showed no pericardial effusion.
Discussion
The fatal complication of acute haemorrhagic tamponade did
not occur in the patient because we promptly recognised cardiac
perforation. One therefore should be cautious when performing
an ablation or when a catheter is mapping the left ventricular
apex, and too much tension should be avoided in the catheter.
Subtle changes in electrode potentials should be promptly
recognised to rapidly detect anomalies.
If the heart suddenly fails to follow an impulse or a potential
in the distal electrode of the catheter is significantly abruptly
reduced, it should be suspected that the catheter has probably
penetrated the heart wall and the location of the catheter should
be adjusted as soon as possible. Additionally, if an externally
irrigated radiofrequency ablation catheter is used, a diluted
contrast agent can be injected via the catheter lumen to ensure
the location of the catheter tip.
If the contrast agent rapidly spreads along the edge of the
heart in angiography, the possibility that it has gone into the
pericardial cavity should be considered, and the tip of the
catheter might also have penetrated into the heart wall. The
contrast agent did not rapidly spread in our patient, but slowly
moved into a small region along the edge of the heart from the
tip of the ablation electrode. These findings suggested that the
catheter had caused incomplete perforation of the ventricle, with
the tip lying immediately under the epicardium.
Although there was incomplete perforation in the ventricular
apex, the complication of acute tamponade did not occur in
the patient under high-pressure conditions generated within
that chamber during systole. This may be explained by the
anatomical structure of the ventricular apex and the manner in
which the muscle at the apex contracts. Most hearts have one
small point at the apex of the left ventricle at which the thickness
of the myocardium is 3 mm or less.
2-4
Furthermore, the thickness
of the left ventricular apical thin point does not significantly
change at end-diastole and end-systole.
5
In a previous study by Bradfield
et al.
, left ventricular
myocardial thickness increased rapidly on each side of the apical
thin point, so that when measured 5 mm away on one side, the
myocardial thickness was already 3.7
±
2.3 mm on the thinner
side and 7.9
±
6.3 mm on the thicker side.
2
The thickness of the
epicardial fat at the apex was between 4.5 and 4.7 mm,
2
and it
was almost always thicker than the thickness of the myocardium
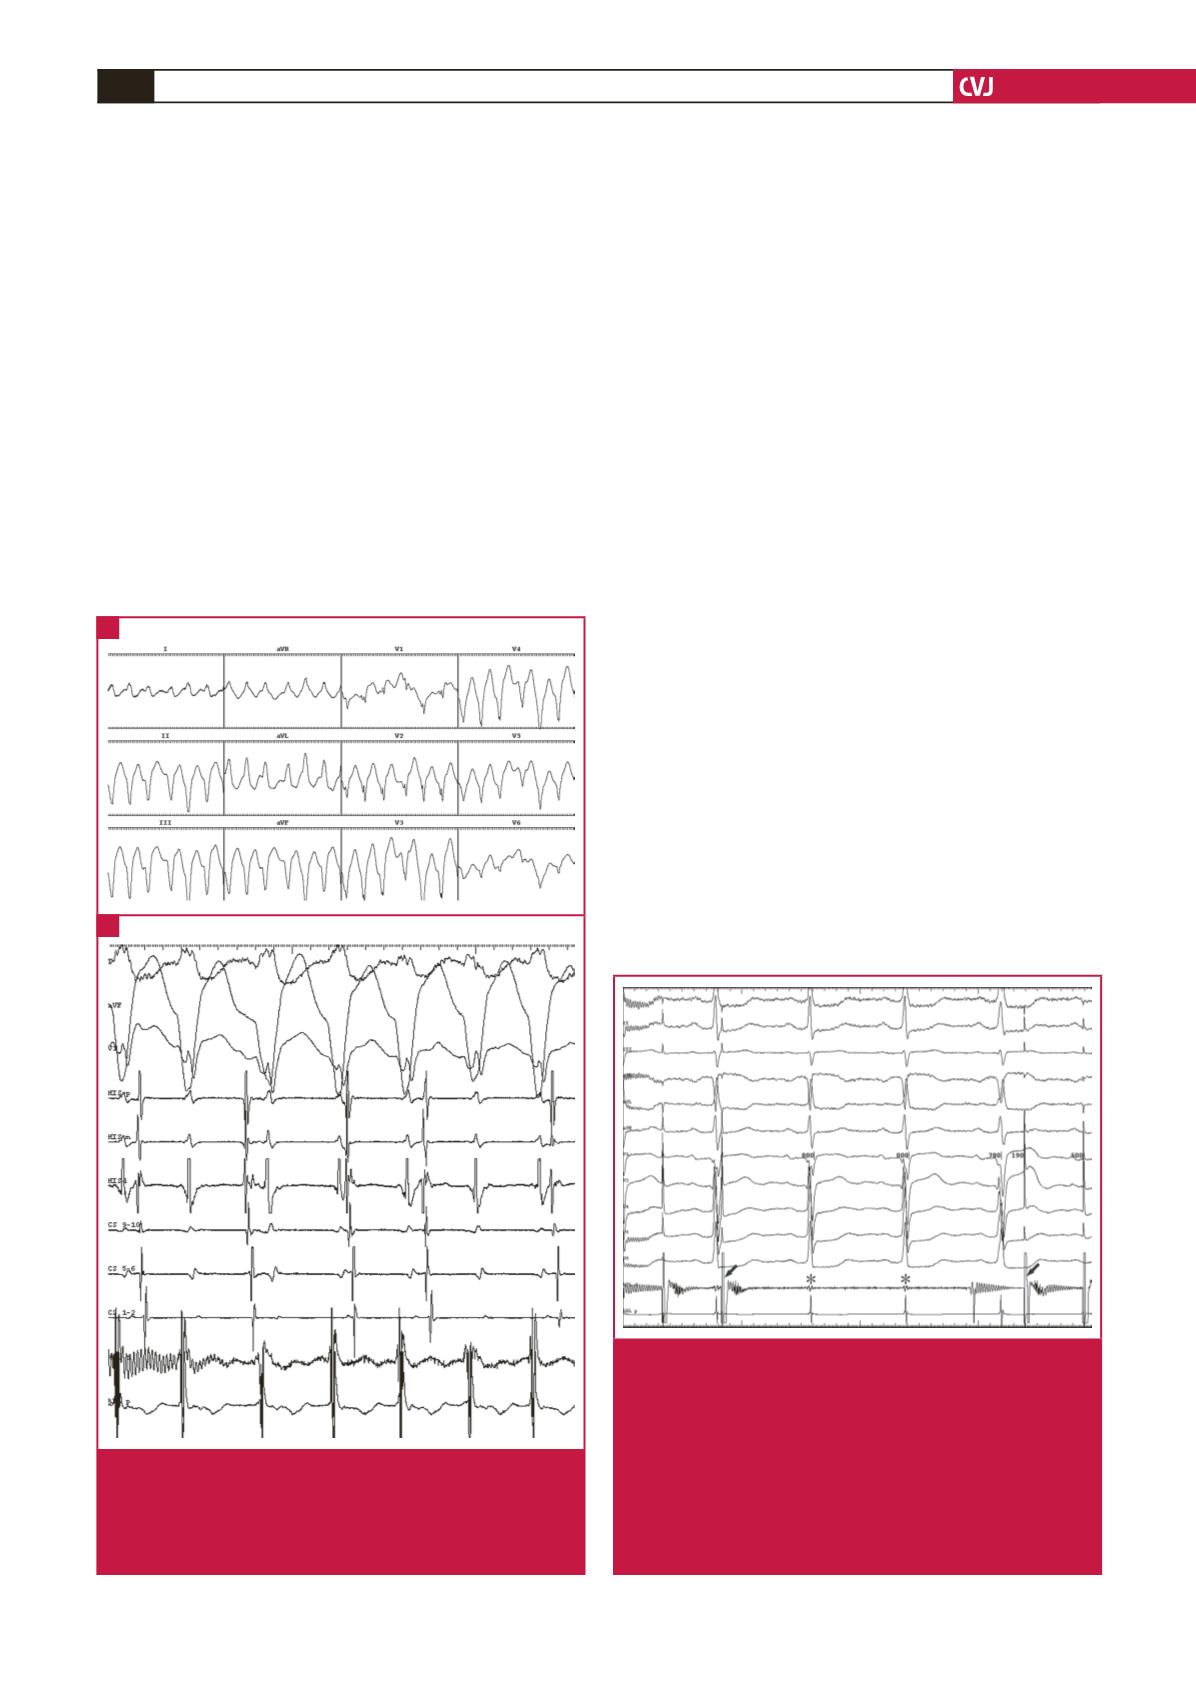
Fig. 1.
Electrocardiogram and intracardiac recordings during
tachycardia. (A) Electrocardiogram showing tachy-
cardia with a wide QRS. (B) Intracardiac recordings
showing ventriculo-atrial dissociation. CS = coronary
sinus; ABL = ablation, d, distal, p, proximal.
A
B
Fig. 2.
Recordings of potentials in the ablation catheter and
an electrocardiogram during pacing mapping in the
left ventricular apex. The recordings of potentials in
the ablation catheter show that the stimulation signal
(arrow) has disappeared and the potential (asterisk) in
the proximal electrode of the catheter is significantly
reduced. After the catheter was slightly withdrawn, the
stimulus signal occurred again. However, the ventricle
still failed to respond to the stimulus signal. ABL =
ablation, d, distal, p, proximal.


