


 34 / 64

S32
AFRICA
CVJAFRICA • Volume 26, No 2, H3Africa Supplement, March/April 2015
Using these models, the leading CVD cause of death and
disability in 2010 in sub-SaharanAfrica was stroke.
3
Furthermore,
Krishnamurthi
50
reported higher age-adjusted stroke mortality
rates for haemorrhagic stroke in sub-Saharan Africa than in
North America and Europe.
Overall, the GBD generated an age-standardised stroke
mortality rate of between 52.0 and 136.7 per 100 000 people
for 2010.
2,49
Indeed there was as much as a 10-fold difference
between the lowest stroke mortality rates, seen primarily in
developed nations, and the highest mortality rates, seen primarily
in numerous countries across central and western Africa and
other LMIC.
5
In addition to comparing the mortality rates at a given time
point, it is also important to examine the trend to forecast future
disease burden. In the Seychelles, mortality rates (per 100 000,
age-standardised to WHO standard population) decreased from
250/140 (male/female) to 141/86 for stroke, corresponding to
44/39% over 22 years. However, overall stroke mortality rates
remained high, emphasising the need to strengthen neurological
disease prevention and control.
2,49
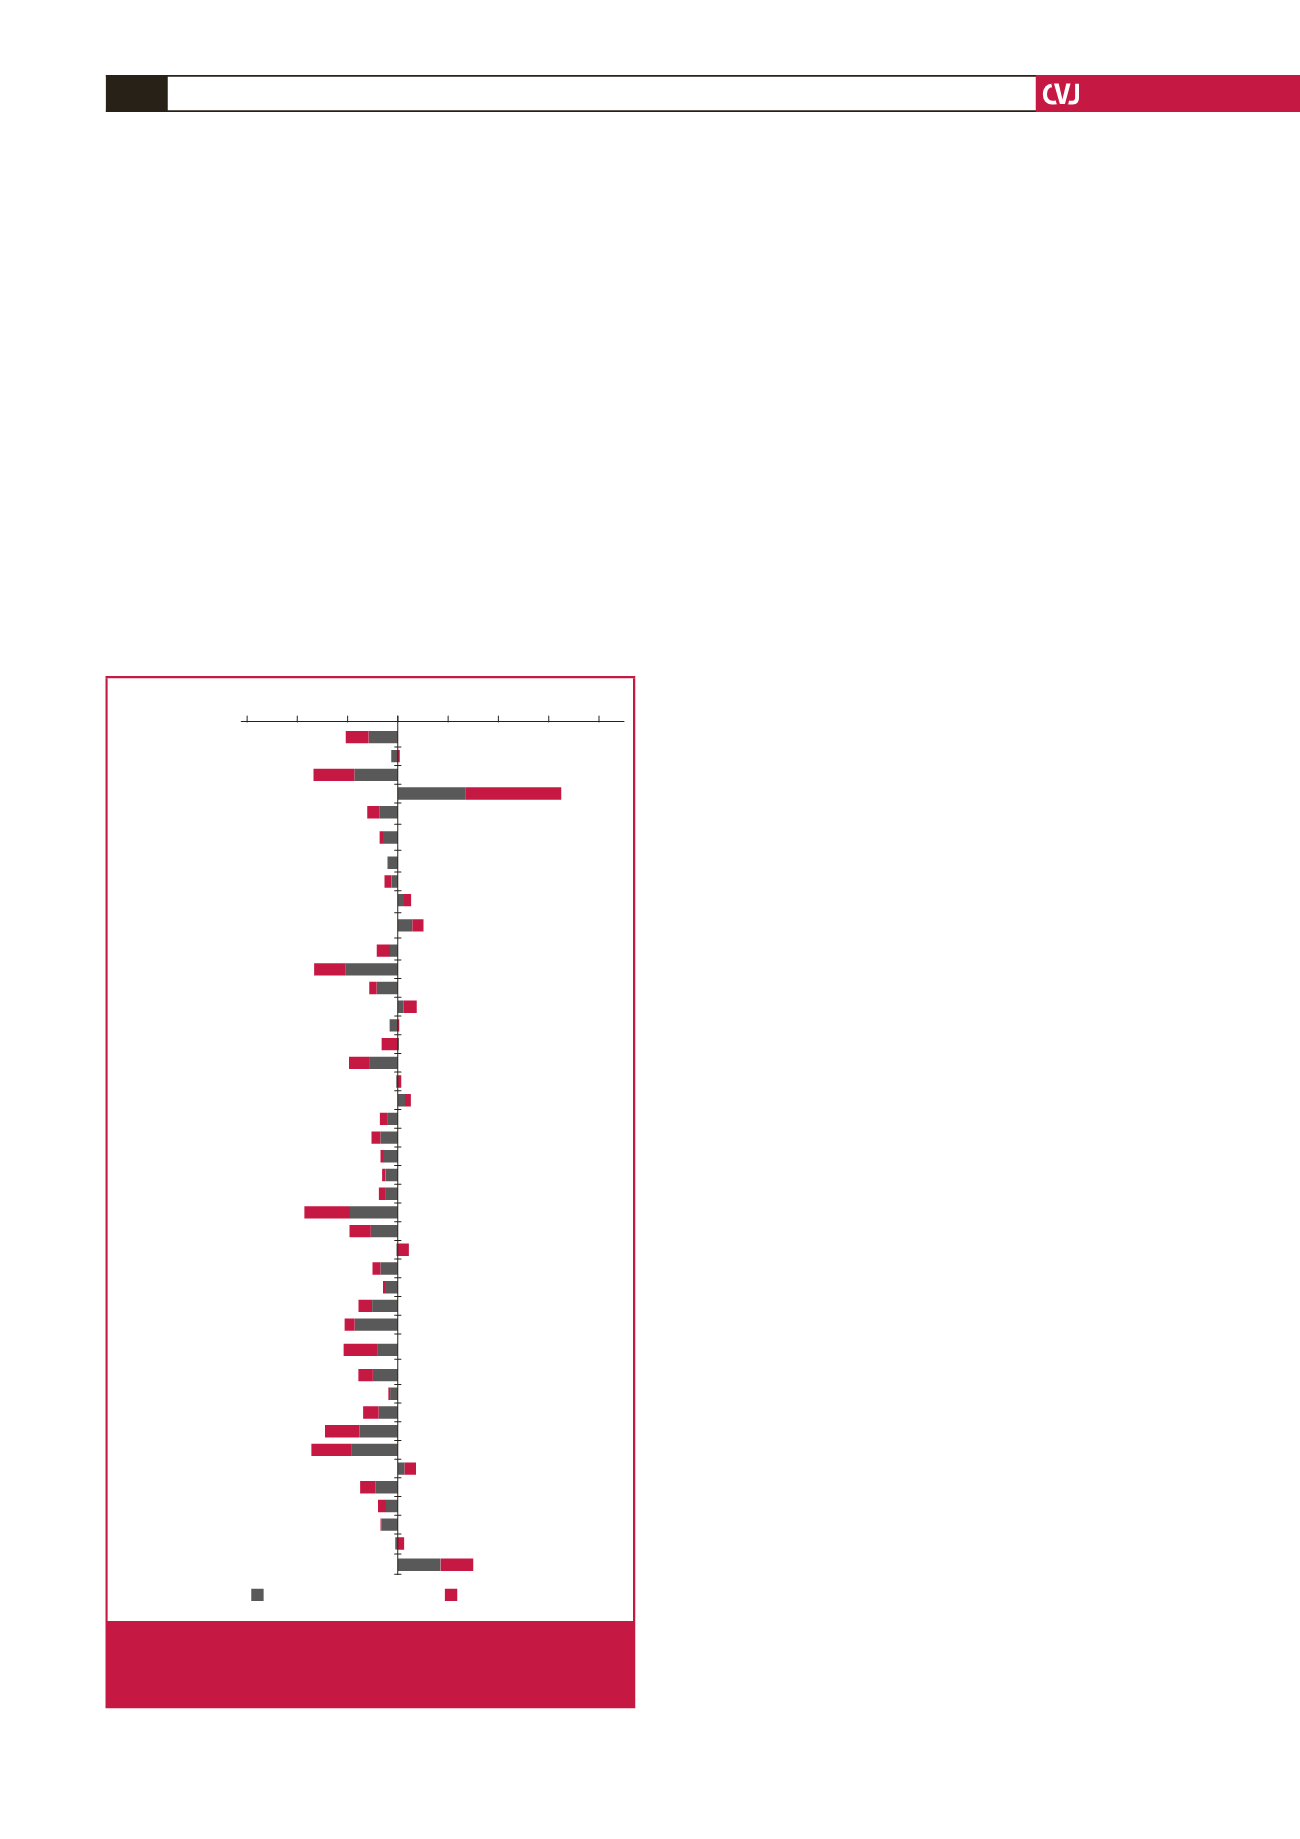
Using the GBD data (Table 3, Fig. 3), percentage change in
age-standardised ischaemic stroke mortality rates from 1990 to
2010 ranged between –45.5% (Mauritius) and 95.0% (Burkina
Faso). Overall, in Africa, there was a statistically significant (
p
=
0.001) median change in age-standardised ischaemic stroke
mortality rates of –7.5% between 1990 and 2010. Similarly,
(Table 3, Fig. 5), change in age-standardised haemorrhagic
stroke mortality rates for the same period ranged between
–52.2% (Equatorial Guinea) and 67.9% (Burkina Faso). Overall,
in Africa, there was significant (
p
<
0.001) median change in
age-standardised haemorrhagic stroke mortality rates of –12.7%
between 1990 and 2010.
In the GBD, although age-standardised mortality rates
decreased between 1990 and 2010 in Africa, crude mortality rates
increased in sub-Saharan Africa, south Asia, and central and
Latin America, but decreased in high-income North America,
western and central Europe, North Africa and the Middle East,
Australasia, and high-income Asia Pacific.
2,49
These changes are
in keeping with the expected increase in crude mortality rate due
to the increasing crude incidence.
23
Africa is at an earlier stage of health transition with a higher
ratio of stroke death to coronary death.
51,52
As a population
undergoes health transition, the pattern of vascular disease
is thought to change from one dominated by stroke, with a
high proportion caused by cerebral haemorrhage, to a pattern
dominated by atherosclerotic stroke, coronary heart disease and
peripheral vascular disease.
16,53
This scenario is expected to occur
in Africa, as suggested by a study exploring the relationship of
vascular risk factors to stroke type among Africans, in which
we found age above 61 years and previous transient ischaemic
attack to be associated with ischaemic stroke, while uncontrolled
hypertension predicted haemorrhagic stroke.
54
With increasing proportion of the population over 61 years
and improving control of blood pressure, the proportion of
ischaemic stroke is expected to rise in African countries.
54
Therefore, relevant components of the stroke-intervention
quadrangle (described below) should be tailored toward this
need to mitigate the burden.
54
Case fatality
Hospital-based studies have demonstrated a one-month case
fatality rate of between 27 and 46% in Africans.
16,32,55
In the
hospital-based INTERSTROKE study, the one-month case
fatality rate for stroke was 22% in the African region compared
to 4% in high-income countries.
56
Reports of post-stroke deaths
in sub-Saharan Africa are, however, unreliable due to factors
such as limited death certification and lack of coverage of
primary healthcare services.
55
Post-stroke case fatality rates
should ideally be calculated using community-based studies
because of the heterogeneity of stroke type and severity, and
the likelihood that many patients are not admitted to hospital.
16
In the Ibadan community-based stroke registry (1975), case
fatality rate at three weeks was 35% for all strokes and highest
for cerebral haemorrhage (61%) and subarachnoid hemorrhage
(62%). However, this case fatality rate may not be very reliable
because stroke types had most probably been diagnosed
unreliably without CT scanning.
20,57
Algeria
Benin
Botswana
Burkina Faso
Burundi
Central African
Republic
Chad
Congo
Côte d’Ivoire
Democratic
Republic of Congo
Egypt
Equatorial Guinea
Ethiopia
Ghana
Guinea
Guinea-Bissau
Kenya
Lesotho
Liberia
Libya
Madagascar
Malawi
Mali
Mauritania
Mauritius
Morocco
Mozambique
Namibia
Niger
Nigeria
Rwanda
São Tomé
and Príncipe
Senegal
Sierra Leone
Somalia
South Africa
Sudan
Swaziland
The Gambia
Togo
Uganda
Zambia
Zimbabwe
–150 –100 –50 0 50 100 150 200
Country
Haemorrhagic stroke
Ischaemic stroke
Fig. 3.
Model-derived percentage changes in ischaemic and
haemorrhagic stroke mortality rates in African coun-
tries between 1990 and 2020.