
CARDIOVASCULAR JOURNAL OF AFRICA • Volume 28, No 1, January/February 2017
AFRICA
33
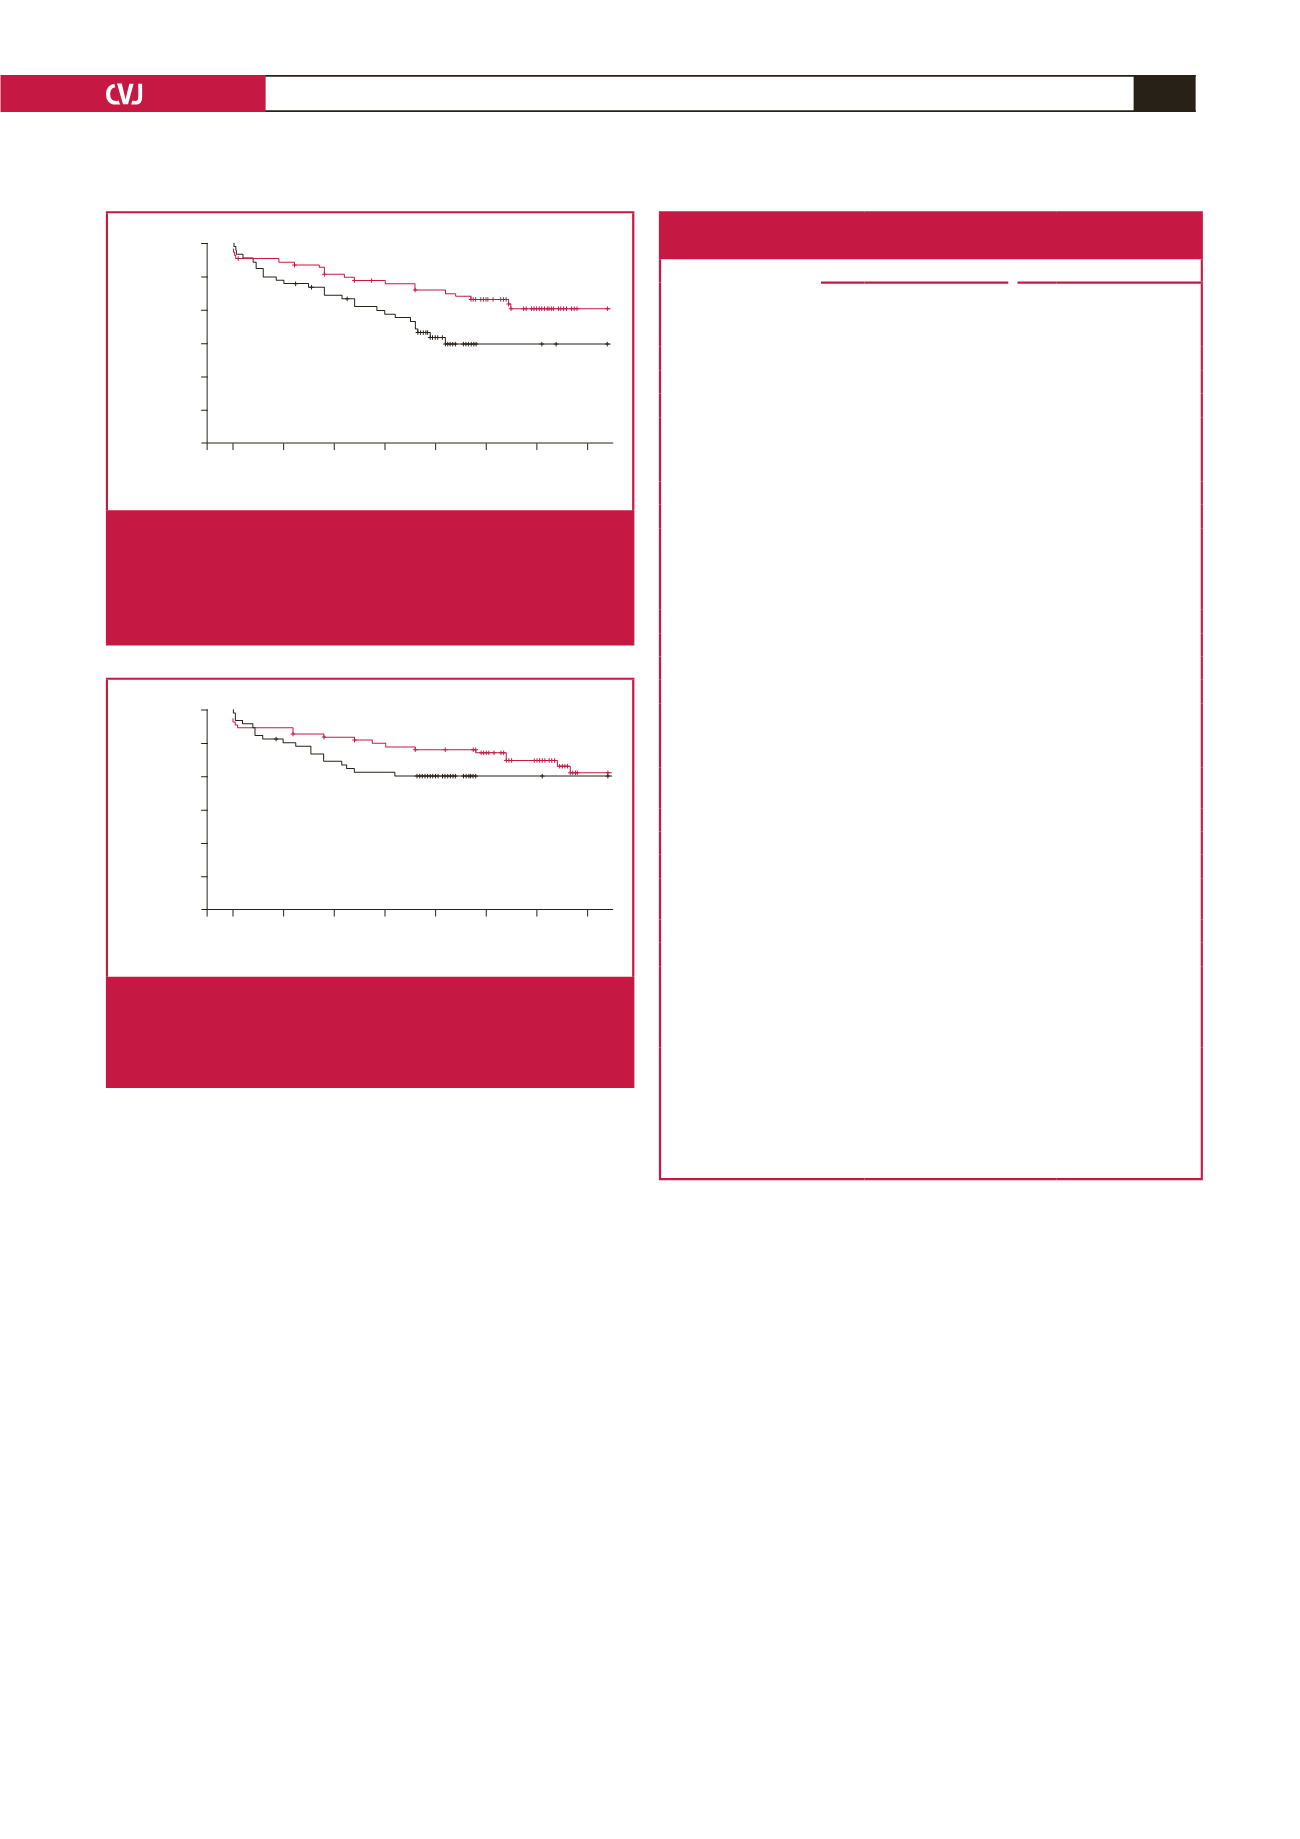
Kaplan–Meier analysis of freedom from MACE revealed
significantly lower event-free survival rates in the OPCAB group
(ONBHCAB, 84.9%; OPCAB, 90.3%;
p
=
0.029 by the log-rank
test) (Fig. 1). Kaplan–Meier analysis of freedom from mortality
revealed no significant difference between the two groups
(ONBHCAB, 90%; OPCAB, 90.5%;
p
=
0.16 by the log-rank
test) (Fig. 2). In the multivariable Cox proportional hazard
model, the mean number of transfused RBC units was the only
independent significant predictor of MACE (Table 3).
Discussion
OPCAB has the potential to reduce several of the adverse effects
of CCAB because of elimination of CPB, the harmful
effects of
cardioplegia, the cessation of coronary blood flow, and excessive
aortic manipulation. Its superiority compared with CCAB in
early or mid-term outcomes has therefore been reported by many
authors.
9-12
However, the risk of haemodynamic instability during
surgery, causing incomplete revascularisation, especially in the
hands of an inexperienced surgeon, remains the major limitation
of this method.
A third method, ONBHCAB, reduces myocardial ischaemia,
maintaining coronary blood flow, preserves haemodynamic
stability with the use of CPB, and permits cardiac manipulation.
Moreover, it also limits aortic manipulation and protects the
heart from post-cardioplegic intimal damage, as well as OPCAB
surgery. A recent meta-analysis showed that ONBHCAB was
associated with significantly fewer peri-operative MIs and less
IABP use, shorter CPB time, and lower total blood loss compared
with CCAB. However, it was similar in terms of cerebrovascular
events, renal dysfunction, pulmonary complications, re-operation
due to bleeding, inotropic agent use, intensive care unit stay,
hospital stay, ventilation time, number of anastomoses, early
mortality and mid-term survival rates after CABG.
7
Another recent meta-analysis revealed that OPCAB was
associated with significantly fewer incidents of peri-operative
low cardiac output (LCO) and renal dysfunction, less total
blood loss, fewer RBC transfusions, shorter ventilation times and
lengths of ICU or hospital stay, but similar rates of in-hospital
or long-term mortality, peri-operative MIs and cerebrovascular
accidents within the first 30 days compared with CCAB.
Moreover, OPCAB was also associated with an increased risk of
repeat revascularisation within the first month and significantly
lower numbers of performed grafts.
Follow up (months)
0 20 40 60 80 100 120 140
Freedom from MACE
1.00
0.95
0.90
0.85
0.80
0.75
0.70
ONBHCAB
OPCAB
p
=
0.029
Fig. 1.
Kaplan–Meier estimates in the propensity-matched
populations. Freedom from major adverse cardio-
vascular events (MACE). Red lines indicate OPCAB
group, black lines indicate ONBHCAB group (
p
=
0.029
by the log-rank test).
Table 3. Cox proportional hazard model for MACE at the long-term follow
up of propensity-matched patients
Univariate analysis
Multivariate analysis
Characteristics
HR
95% CI
p
-value HR 95% CI
p
-value
Pre-operative
characteristics
Age
1.026 0.992–1.061 0.14
Males
1.519 0.77–2.998 0.22
EuroSCORE
1.299 1.140–1.479
<
0.001* 1.051 0.873–1.265 0.59
Obesity
(BMI
≥
30 kg/m
2
)
1.891 1.006–3.557 0.048* 1.681 0.812–3.481 0.16
CrCl
0.999 0.991–1.007 0.75
COPD
2.534 0.999–6.425 0.05 1.102 0.317–3.826 0.87
Diabetes mellitus
1.297 0.705–2.389 0.4
Cerebrovascular
disease
1.439 0.446–4.641 0.54
Peripheral vascular
disease
2.335 1.183–4.609 0.01* 0.982 0.366–2.634 0.98
Previous MI
2.619 1.454–4.716 0.001* 1.764 0.808–3.851 0.15
Impaired LV function 1.951 1.074–3.542 0.02* 1.186 0.529–2.659 0.68
USAP
1.446 0.796–2.625 0.22
Previous PCI
0.727 0.176–3.000 0.65
Number of diseased
vessels
1.806 0.923–3.534 0.08 1.435 0.664–3.099 0.35
Operative factors
Number of distal
anastomoses
0.921 0.658–1.288 0.63
CPB time
1.005 0.991–1.019 0.51
Total blood loss (ml) 1.001 1.000–1.002 0.18
RBC (units)
1.328 1.141–1.545
<
0.001* 1.218 1.089–1.361 0.001*
Postoperative
inotropic support
1.847 0.913–3.733 0.08 1.047 0.584–7.825 0.25
Peri-operative MI
2.764 1.170–6.530 0.02* 1.642 0.474–5.695 0.43
Renal complications 2.131 0.951–4.778 0.06 0.836 0.269–2.597 0.75
Neurological
complications
2.554 0.914–7.135 0.07 2.137 0.584–7.825 0.25
Early rehospitalisa-
tion (
<
30 days)
2.852 1.273–6.387 0.011* 1.256 0.410–3.851 0.69
*Statistically significant difference.
BMI, body mass index; CABG, coronary artery bypass graftıng; CI, confidence
interval; CrCl, creatinine clearance; COPD, chronic obstructive pulmonary
disease
;
DM, diabetes mellitus; HR, hazard ratio; LV, left ventricle; MI, myocardi-
al infarction; ONBHCAB, on-pump beating heart coronary artery bypass surgery;
OPCAB, off-pump coronary artery bypass surgery; PCI, percutaneous coronary
intervention; RBC, red blood cell, USAP, unstable angina pectoris.
Follow up (months)
0 20 40 60 80 100 120 140
Freedom from mortality
1.00
0.95
0.90
0.85
0.80
0.75
0.70
ONBHCAB
OPCAB
Fig. 2.
Kaplan–Meier estimates in the propensity-matched
populations. Freedom from mortality. Red lines indi-
cate OPCAB group, black lines indicate ONBHCAB
group (
p
=
0.16 by the log-rank test).


