CARDIOVASCULAR JOURNAL OF AFRICA • Vol 21, No 5, September/October 2010
AFRICA
259
terol diet group were significantly increased (all
p
<
0.01), but
the increase in HDL-C levels was not significant (
p
>
0.05).
SerumTC, TG, LDL-C and ox-LDL levels were not significantly
different among all three experimental groups (Table 1).
Compared with the C group, the levels of serum NO in all
three experimental groups were significantly decreased (all
p
<
0.01). The levels of serum NO among these three groups were
not significantly different (Table 1).
Compared with the C group, the ET-1 content in the blood
plasma and aortic tissue in all three experimental groups
was significantly increased (all
p
<
0.01). Compared with
the Ch group, the ET-1 content in the Hm group was signifi-
cantly decreased and that in the Zn group was significantly
increased (all
p
<
0.01) (Tables 1, 2).
There was no atheromatous plaque in the rabbit aortic tunica–
intima in the C group. The plaque area in the Ch, Hm and Zn
groups was 54.00
±
4.16%, 17.88
±
3.01% and 61.13
±
3.50%,
respectively. Compared with the Ch group, the plaque area in the
Hm group was significantly decreased (
p
<
0.01), but that in the
Zn group was significantly increased (
p
<
0.01).
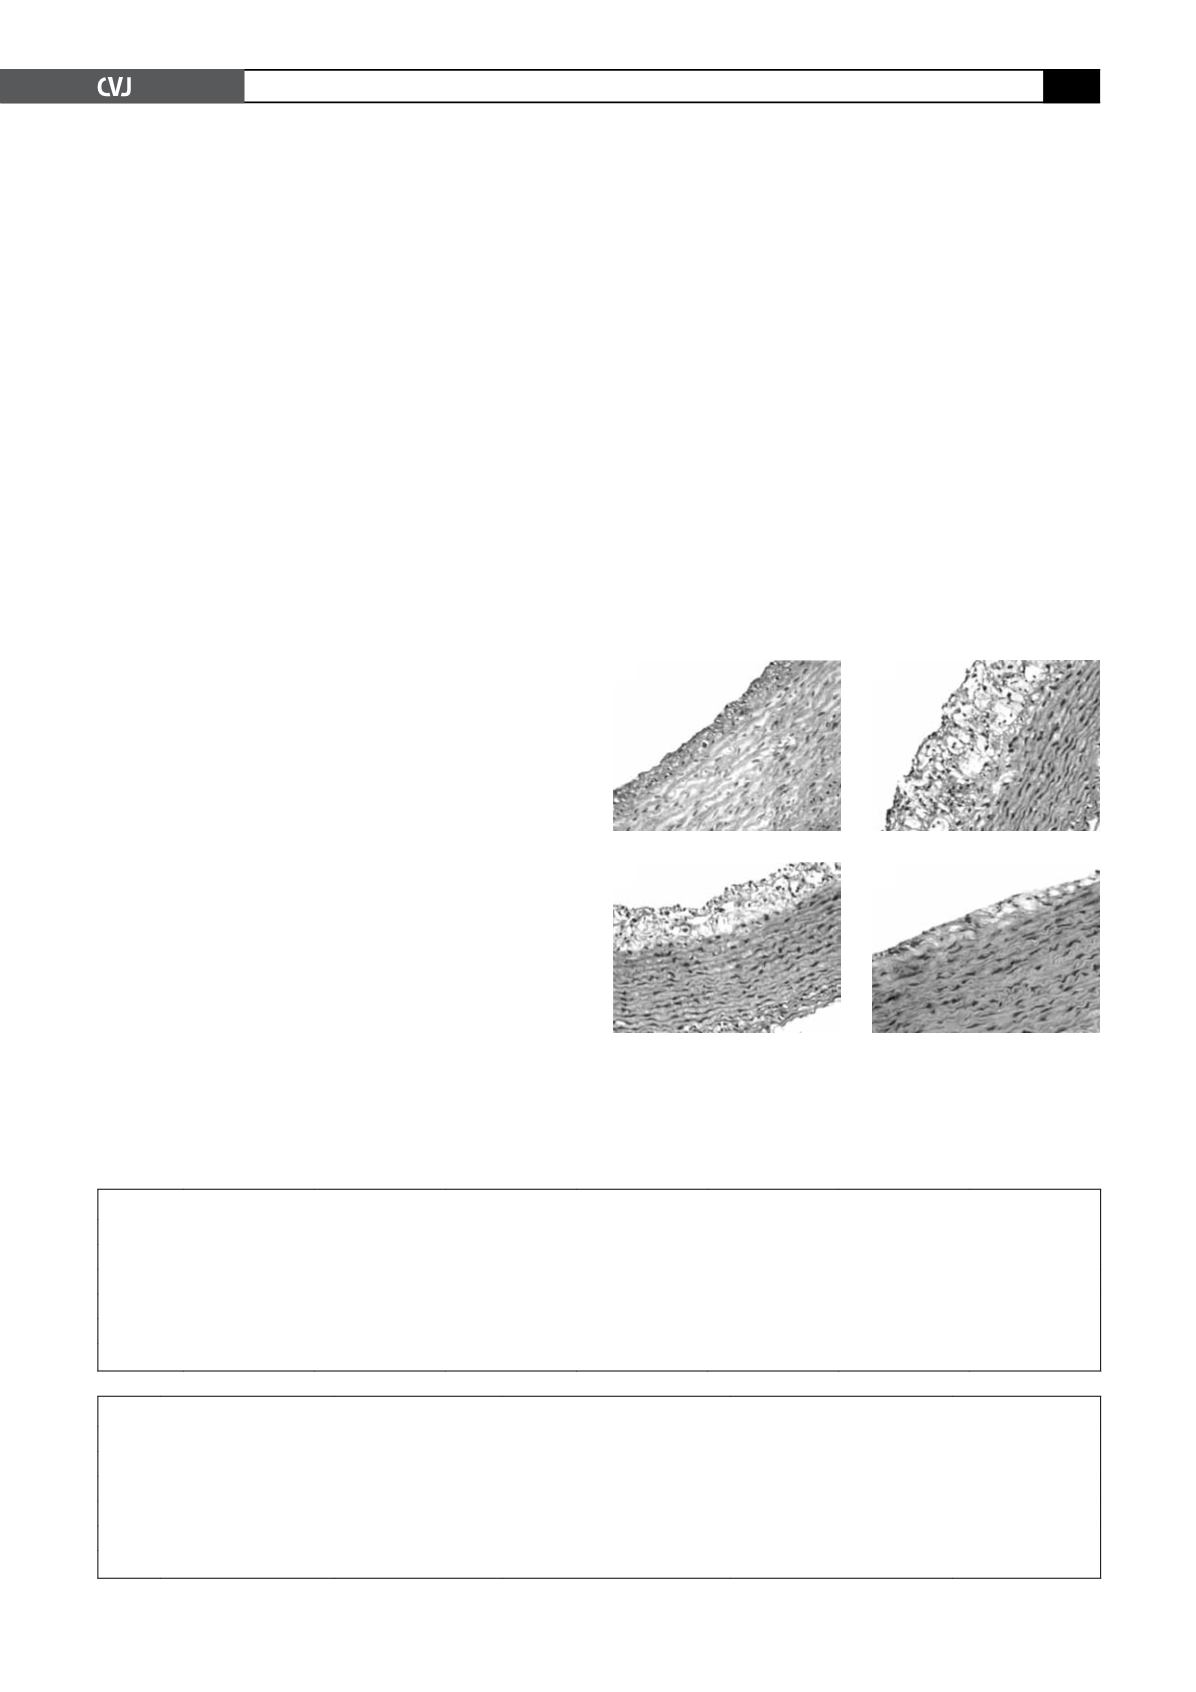
In the C group (Fig. 1), the single-layer endodermis on the
luminal surface was intact and the smooth muscle layer was regu-
larly arranged. In the Zn group, the endothelium was damaged
and the tunica–intima was significantly thickened with 11 to 12
layers of foam cells. The smooth muscle layer was disorganised
and extended to the tunica–intima, with significant atrophy. In
the Ch group, endothelial cells were extensively damaged. The
tunica–intima was thickened, with eight to nine layers of foam
cells, while the degree of smooth muscle atrophy was less than in
the Zn group. In the Hm group, the tunica–intima was complete,
with occasional foam cells.
Production of aortic NO and CO and NOS activity
Compared with the C group, the production of NO in the Ch
group reduced by 27% and the production of CO increased
by 55%. cNOS activity decreased by 44%, and iNOS activity
increased by 48% (all
p
<
0.01). In the Hm group, the produc-
tion of NO reduced by 28%, and the production of CO increased
by 119%. cNOS activity decreased by 43%, and iNOS activity
increased by 24% (all
p
<
0.01). In the Zn group, the produc-
tion of NO and CO reduced by 26 and 54%, respectively. cNOS
activity decreased by 44%, and iNOS activity increased by 74%
(all
p
<
0.01).
Compared with the Ch group, the production of CO signifi-
cantly increased in the Hm group, and iNOS activity signifi-
cantly decreased (all
p
<
0.01). The production of NO and
cNOS activity were not significantly different between these two
groups. The production of CO was significantly decreased, and
iNOS activity was significantly increased in the Zn group (all
p
<
0.01). The production of NO, and cNOS activity were not
significantly different between these two groups (Table 2).
Expression of HO-1 and ET-1 in aortic tissue
As shown in Figs 2 and 4, HO-1 was mainly expressed in the
aortic endothelial cells, foam cells and smooth muscle cells. In
the C group, a small number of positive cells were distributed in
the tunica–intima. HO-1 was expressed in the endothelial cells.
In the Zn group, there were only a few positive cells, and HO-1
was occasionally expressed in the endothelial and foam cells in
plaques. The expression rate of HO-1 was significantly lower
than in the C group (14.15
±
1.12 vs 19.02
±
1.28%,
p
<
0.01).
TABLE 1. DETECTION OF SERUM LIPIDS, OX-LDL, NOAND ET-1
Groups
TC (mmol/l)
TG (mmol/l)
LDL-C (mmol/l) HDL-C (mmol/l) ox-LDL (
µ
mol/l)
NO (
µ
mol/l)
ET-1 (pg/ml)
C
1.70
±
0.19
0.80
±
0.15
0.80
±
0.12
1.03
±
0.33
1.34
±
0.26
170.75
±
2.25 113.88
±
15.91
Zn
21.20
±
1.89* 3.17
±
1.16* 15.41
±
2.74*
1.01
±
0.20
2.68
±
0.67* 121.49
±
1.23* 198.12
±
17.70*
#
Ch
21.66
±
3.80* 3.05
±
1.38* 15.31
±
2.43*
1.10
±
0.28
2.72
±
0.65* 128.39
±
0.94* 160.00
±
15.32*
Hm
21.86
±
2.32* 3.36
±
1.80* 14.75
±
2.33*
1.10
±
0.30
2.63
±
0.57* 129.19
±
1.66* 127.68
±
16.00*
#
Compared with the C group, *
p
<
0.01; compared with the Ch group,
#
p
<
0.01.
TABLE 2. CO PRODUCTION, NO PRODUCTIONAND NOACTIVITYAND ET-1 INAORTIC TISSUE (MEAN
±
SD)
Groups HbCO (nmol/mg.tissue) NO
-2
(nmol/mg.protein) CNOS (pmol.mg.protein
-1
.min
-1
) INOS (pmol.mg.protein
-1
.min
-1
) ET
-1
(pg/mg. tissue)
C
36.18
±
3.59
120.21
±
18.32
110.22
±
10.84
97.28
±
10.12
20.00
±
3.89
Zn
16.85
±
3.27*
#
88.73
±
15.32*
63.87
±
8.52*
#
169.92
±
13.10*
#
64.43
±
6.02*
#
Ch
56.09
±
5.12*
87.86
±
15.24*
62.01
±
9.87*
144.40
±
12.80*
42.78
±
5.42*
Hm
79.21
±
6.17*
#
86.22
±
13.50*
63.12
±
8.46*
120.96
±
11.50*
#
30.23
±
4.81*
Compared with the C group, *
p
<
0.01; compared with the Ch group,
#
p
<
0.01.
A
B
C
D
Fig. 1. Morphology of the aorta wall in the C (A), Zn (B),
Ch (C) and Hm (D) groups. Except for the C and Hm
groups, all other samples showed shedding of endothe-
lial cells and the presence of foam cells. The tunica–
initima was thickened and the smooth muscle layer was
disorganised and extended towards the tunica–intima.
(H&E staining, magnification 400 X).


