CARDIOVASCULAR JOURNAL OF AFRICA • Vol 21, No 5, September/October 2010
AFRICA
265
Discussion
This article highlights a number of important South African
public health issues. The prevalence of clinical risk predictors
in South African vascular patients was similar to or higher than
that reported in European vascular patients
6
(Table 4), with the
exception of congestive cardiac failure and male gender. This is
consistent with our understanding of epidemiological transition
in a developing country,
8
and an increasing burden of cardiovas-
cular risk factors.
This study allows us to evaluate the relative importance of
clinical risk factors, chronic medical therapy, surgical procedural
TABLE 1. CLINICAL RISK FACTORSAND INTERMEDIATEAND
LONG-TERM MORTALITY FOLLOWINGVASCULAR SURGERY
Clinical risk factors
Non-
survivors
Survivors
p
-value
Pre-operative risk factors
Male gender
12/21 (57%) 170/262 (65%) 0.49
†
Age
64.2
62.4
0.42
History of smoking
12/21 (57%) 162/262 (62%) 0.65
†
Ischaemic heart disease
14/21 (67%) 174/262 (66%) 1.00
†
Congestive cardiac failure
0/21 (0%) 6/262 (2.3%) 0.48
*
Cerebrovascular accident
7/21 (33%) 80/262 (31%) 0.81
†
Diabetes
13/21 (62%) 111/262 (42%) 0.11
†
Hypertension
19/21 (91%) 192/262 (73%) 0.12
†
Creatinine
>
180
μ
mol.l
-1
‡
2/21 (9.5%) 13/242 (5.4%) 0.43
*
Chronic medical therapy
Pre-operative chronic beta-blockade 6/21 (29%) 80/262 (31%) 1.00
†
Pre-operative statin therapy
5/21 (24%) 61/262 (23%) 1.00
†
Mean daily HR day before surgery
73
75
0.42
Major vascular surgery
13/21 (62%) 155/262 (59%) 1.00
†
Mean daily HR day 3 postop
81
82
0.65
HR: heart rate;
*
Pearson Chi-square test,
†
Fisher’s Exact test;
‡
data missing
for 20 cases.
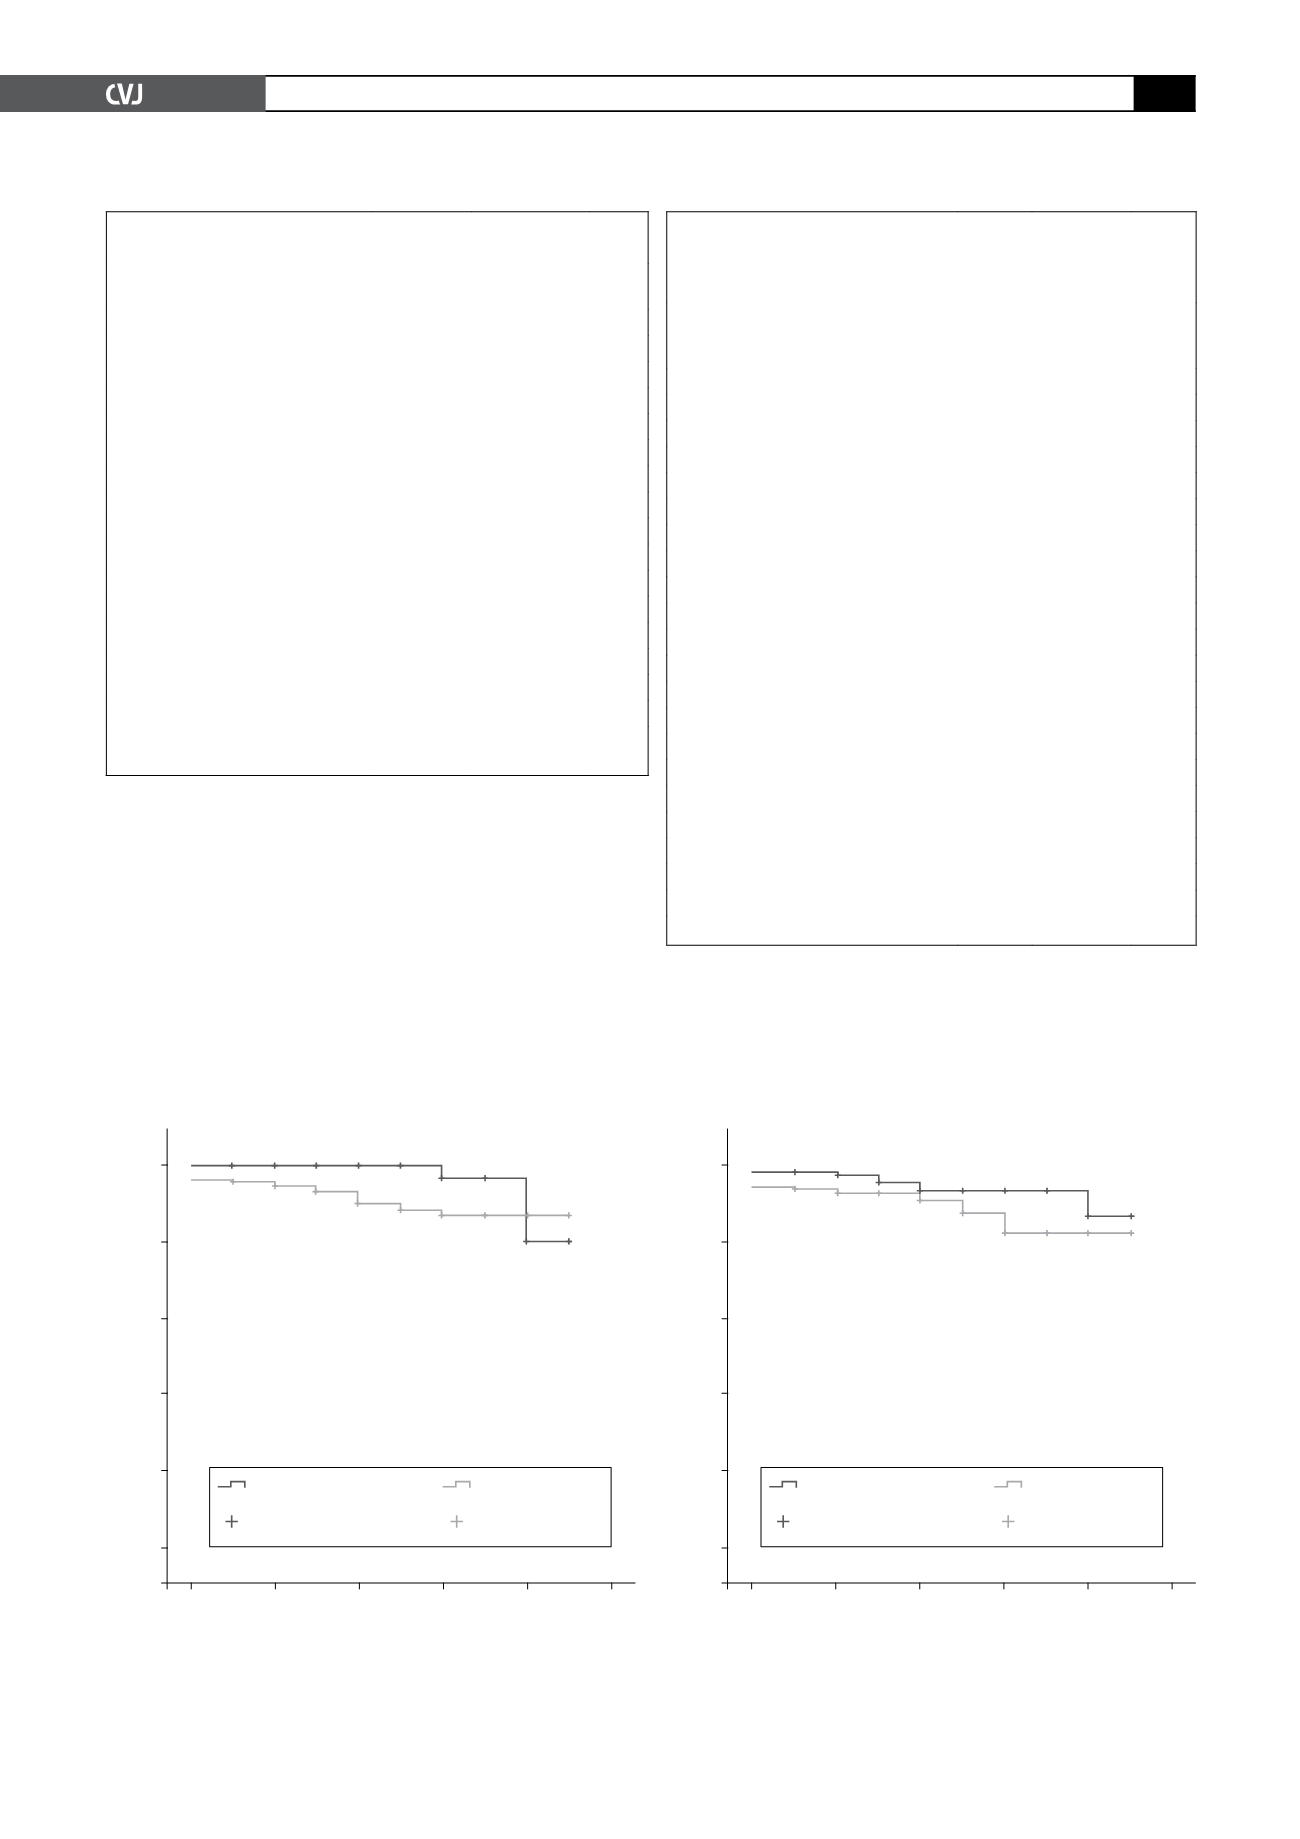
Fig. 1. Kaplan-Meier survival analysis for hypertension.
Log rank (Mantel-Cox) test
χ
2
=
3.415,
p
=
0.065. Breslow
test
χ
2
=
5.49,
p
=
0.019.
1.0
0.8
0.6
0.4
0.2
0.00
Cumulative survival
Postoperative years
0
1
2
3
4
5
No hypertension
Hypertension
No hypertension-
censored
Hypertension-
censored
risk factors and peri-operative physiological data on interme-
diate and long-term survival following vascular surgery. The
Rotterdam study suggested that clinical risk factors associated
with peri-operative cardiac events
6,7
are also predictive of long-
term mortality following peripheral vascular surgery. Our study
TABLE 2. BIVARIATE COX REGRESSIONANALYSIS OF
PREDICTORS OF INTERMEDIATEAND LONG-TERM
ALL-CAUSE MORTALITY FOLLOWINGVASCULAR
SURGERY IN PATIENTS
≥
40YEARS OFAGE
Characteristic
Crude
hazard
ratio 95% CI
p
-value
Pre-operative risk factors
Male gender
0.77 0.32–1.82 0.55
Age
1.02 0.97–1.07 0.40
History of smoking
0.96 0.40–2.28 0.92
Ischaemic heart disease
1.05 0.42–2.61 0.91
Congestive cardiac failure
0.05
0.0–89.0 0.68
Cerebrovascular accident
1.19 0.48–2.94 0.71
Diabetes
2.28 0.94–5.52 0.07
Hypertension
3.59 0.83–15.4 0.09
Creatinine
>
180
μ
mol.l
-1
1.87 0.43–8.06 0.40
Chronic medical therapy
Pre-operative chronic beta-blockade
0.83 0.32–2.13 0.69
Pre-operative statin therapy
0.94 0.34–2.56 0.90
Withdrawal of chronic beta-blockade
1.11 0.37–3.30 0.86
Surgical risk factors
Major vascular surgery
1.05 0.44–2.54 0.91
Surgery out of hours
0.77 0.10–5.75 0.80
Physiological data
Mean daily HR day before surgery
0.98 0.95–1.02 0.37
Mean daily HR day 3 postop
1.0
0.97–1.02 0.52
Mean daily SBP
<
100 or
>
179 mmHg 2.09 0.61–7.08 0.24
CI: confidence interval; SBP: systolic blood pressure; HR: heart rate.
Fig. 2. Kaplan-Meier survival analysis for diabetes. Log
rank (Mantel-Cox) test
χ
2
=
3.604,
p
=
0.058. Breslow test
χ
2
=
4.22,
p
=
0.040.
1.0
0.8
0.6
0.4
0.2
0.00
Cumulative survival
Postoperative years
0
1
2
3
4
5
No diabetes
Diabetes
No diabetes-
censored
Diabetes-
censored


