CARDIOVASCULAR JOURNAL OF AFRICA • Volume 25, No 2, March/April 2014
46
AFRICA
In the second component of the study, the data acquired on
both the GE and Siemens cameras were processed three times by
a single operator (operator 1) using the same software methods,
default settings and intervention as for the first component.
Statistical analysis
The results were entered into an EpiData version 3.1 database.
9
Data were then exported for analysis into Microsoft Office 2007
Excel and STATA version 11.
10
The Shapiro-Wilk test showed that the data were not normally
distributed. Attempts at transformation were unsuccessful.
(Tukeys ladder of transformations was used.) Parametric
statistics were still applied however as it is deemed acceptable to
apply parametric statistics if the number of subjects exceeds 30.
Means, standard deviations (SDs) and ranges (maximum and
minimum) of estimates of LVEF were calculated. The Bland-
Altman method of comparison analysis was used to assess the
estimates of LVEFs as well as the impact of acquisition on
different cameras. Analysis of variance was used to establish
the statistical significance. The reproducibility of LVEFs was
assessed using the SD of the three estimates of LVEF calculated
by each operator for each method.
Results
Values and reproducibility of estimates of LVEFs
The left ventricle was not tracked in four studies when using
the Siemens method. In all four studies the entire heart or the
vascular structures above it were tracked. All three operators were
in agreement in three of these studies. In one study only operator
3 was unable to track the left ventricle. The corresponding mean
estimates of LVEF for these studies using the Hermes method
were 36, 67, 66 and 74%.
With the Hermes method, the left ventricle was not tracked in
one study. In this study the entire heart was tracked. Operators 1
and 2 were in agreement in this study; operator 3 however, was
able to track the left ventricle. The corresponding mean estimate
of LVEF for this study using the Siemens method was 63%.
These five studies were from different patients. The exclusion
of the five studies left 194 studies for analysis.
Table 1 summarises the values for the estimates of the
LVEFs. There were no differences between the results obtained
by the three operators but the Siemens method gave estimates
that were 4.3% higher than those given by the Hermes method.
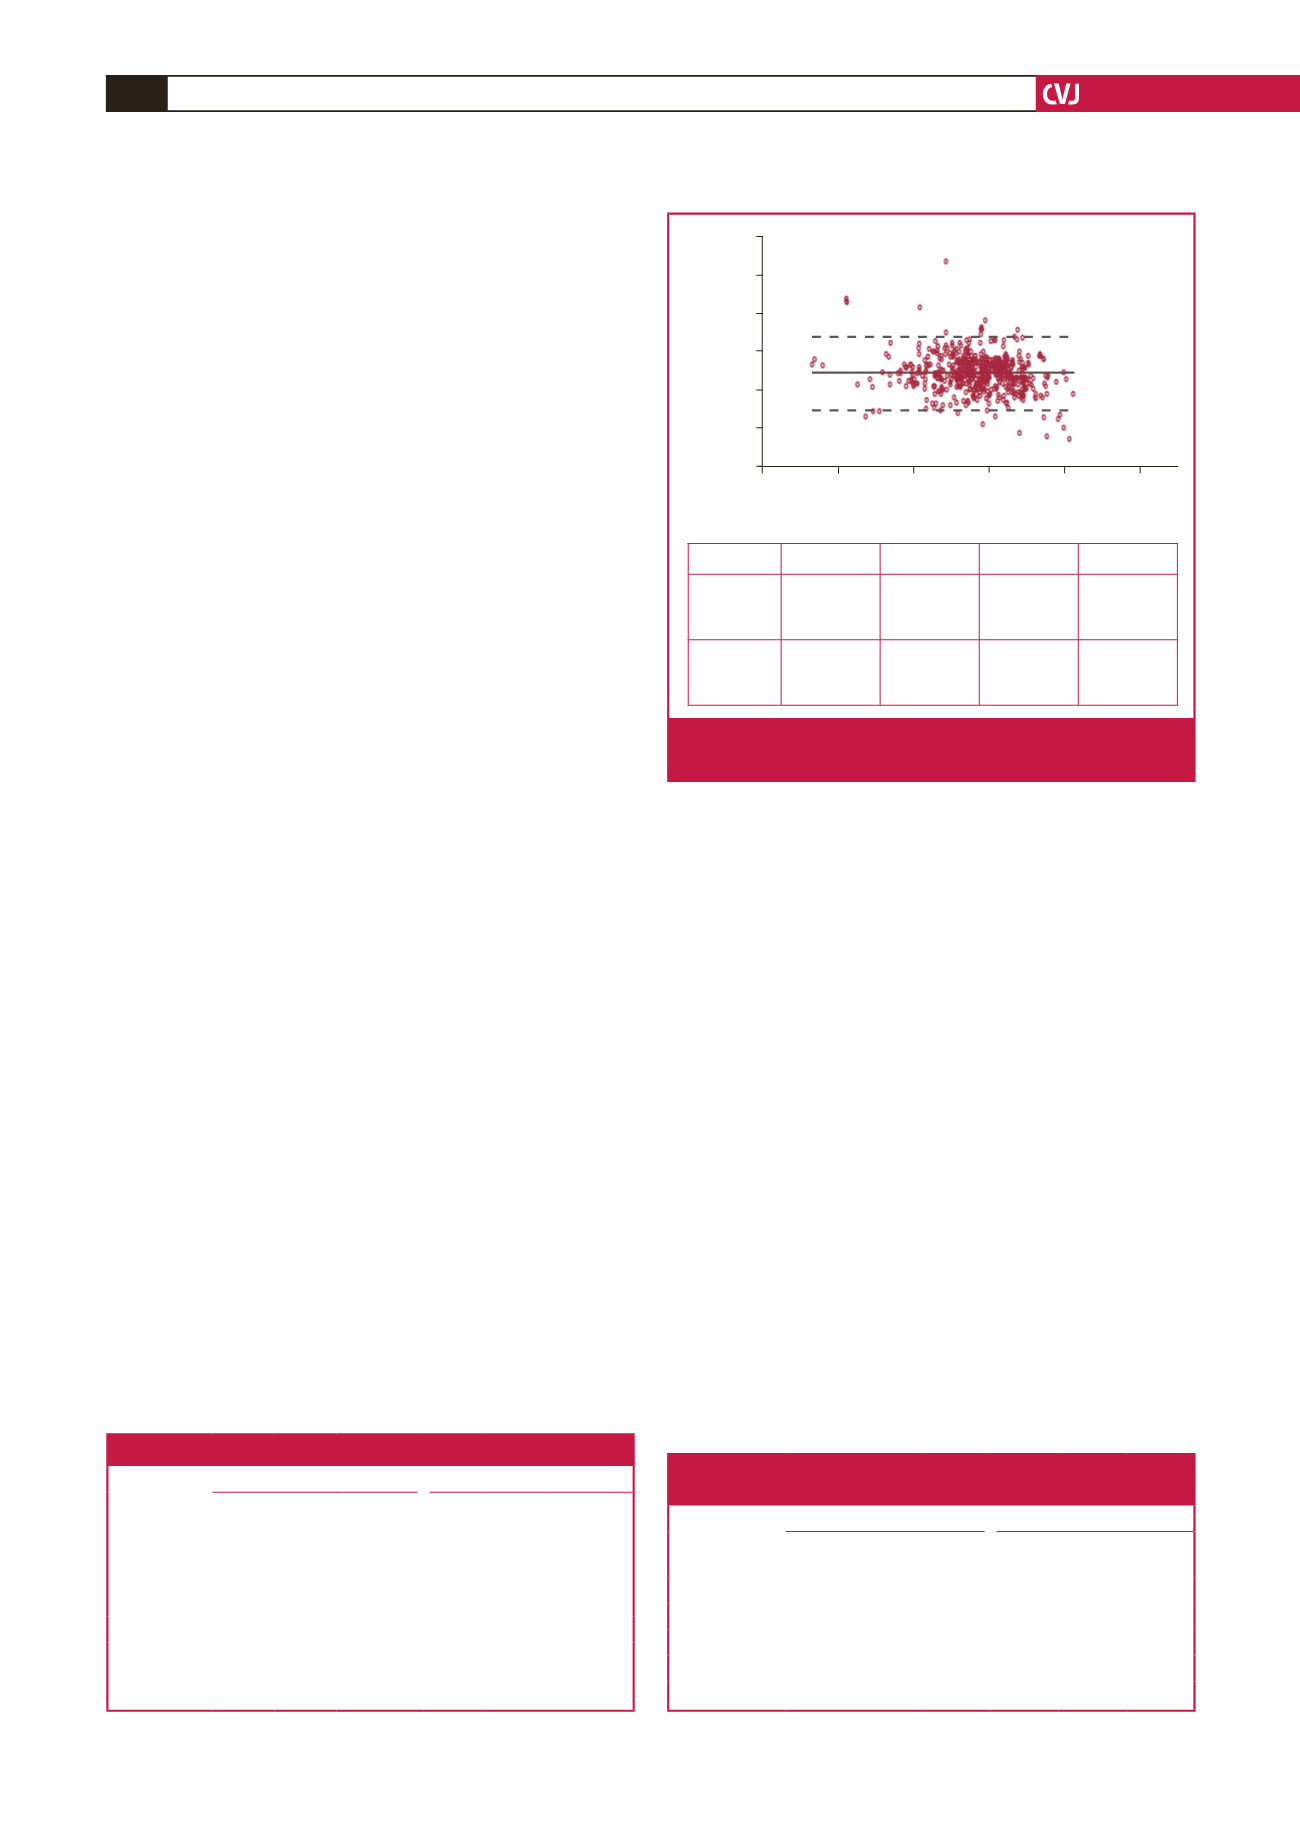
The differences between the two methods were not related to
the values obtained for the LVEFs, and the limits of agreement
between the two methods were almost identical for all three
operators (Fig. 2).
Of the five highest and five lowest estimates of LVEF
obtained with each method by each operator, four of the highest
five LVEFs and four of the lowest five LVEFs were from the
same studies for each method by all three operators. Out of the
five highest, three of the four were the same for both methods. Of
the five lowest however, only one was the same for both methods.
Table 2 summarises the reproducibility of the estimates of
the LVEFs. There were 53 patients in whom the SD of the three
estimates of the LVEFs was above the 95th percentile for both
methods for one or more operators. In most of these patients, two
of the three estimates obtained by any one of the operators for a
method were similar. The difference between these two similar
estimates (minimum difference) was 0% in 14 patients, 1% in
26 patients, 2% in eight patients and 3% in five patients. The
difference between the highest and lowest estimates (maximum
difference) for all three operators for both methods was 3%
in eight patients, 4% in 17 patients, 5% in 19 patients, 6% in
six patients, 8% in two patients and 9% in one patient. The
maximum difference for all three operators was 6% or less for
the Siemens method and 9% or less for the Hermes method. The
difference between the minimum and maximum estimates was
not associated with any particular level of LVEF.
Table 1. Values of estimates of lvefs; all operators
Siemens
Hermes
Mean
(%)
SD
Range
(%)
Mean
(%)
SD
Range
(%)
Operator 1 59.1 10.1 19.3–82.0 54.8 11.0 11.0–88
Operator 2 59.5 10.1 18–82.3 54.7 11.0 10.0–82.3
Operator 3 58.8 10.3 16.7–82 54.6 11.4 10.0–85
All operators 59
10.2 16.7–82.3 54.7 11.1 10.0–88
There was a difference between methods (F 650, 54; df 1, 97;
p
<
0.0001)
but no difference between operators (F 1, 72; df 2, 97;
p
=
0.18) and no
interaction between operator and method (F 0, 90; df 2, 97;
p
=
0.41).
Table 2. Percentiles of the sds of the three estimates of
lvef for the Siemens and Hermes methods
Siemens method
Hermes method
Opera-
tor 1
Opera-
tor 2
Opera-
tor 3
Opera-
tor 1
Opera-
tor 2
Opera-
tor 3
5th percentile
0.0
0.0
0.0
0.0
0.0
0.0
25th percentile 0.6
0.6
0.0
0.6
0.0
0.0
50th percentile 0.6
0.6
0.6
0.6
0.6
0.6
75th percentile 1.2
1.2
0.6
1.5
1.0
1.1
95th percentile 1.7
2.1
1.3
2.5
2.0
2.1
Operator 1 Operator 2 Operator 3 All Operators
Limits of
agreement
(LOA)
–5.021 to
13.737
–3.995 to
13.441
–6.445 to
14.770
–5.180 to
14.010
Mean
difference
4.358
(CI: 3.694–
5.022)
4.723
(CI: 4.106–
5.340)
4.162
(CI: 3.411–
4.913)
4.415
(CI: 4.024–
4.805)
40.0
30.0
20.0
10.0
0.0
–10.0
–20.0
0.0 20.0 40.0 60.0 80.0 100.0
Mean LVEF (%)
Difference (Siemens–Hermes)
Upper LOA
Mean
difference
Lower LOA
Fig. 2.
Bland–Altman plot: difference between methods, all
operators


