CARDIOVASCULAR JOURNAL OF AFRICA • Volume 25, No 2, March/April 2014
AFRICA
47
Values and reproducibility of estimates of LVEFs
acquired on two cameras
Both studies of one patient could not be processed because the
left ventricle could not be tracked by either method. There were
a further seven studies from five patients in which the data
acquired on one of the cameras could not be processed by one
of the methods. Of these studies, four were acquired on the GE
camera and three on the Siemens camera.
For the studies acquired on the GE camera, the Siemens
method tracked the heart and the left atrium in two studies
(corresponding mean estimates of LVEF obtained by the Hermes
method were 60 and 58%). The Hermes method tracked the heart
and aorta in two studies (corresponding mean estimates of LVEF
obtained by the Siemens method were 60 and 59%).
For the studies on the Siemens camera, the Siemens method
tracked the left atrium and the aorta in two studies (corresponding
mean estimates of LVEF obtained by the Hermes method were
63 and 61%, respectively), and the Hermes method tracked the
entire heart in one study (corresponding mean estimates of LVEF
obtained by the Siemens method was 60%). This left 185 patients
for analysis.
Tables 3 and 4 summarise the values of the estimates of
LVEF acquired on both cameras. There was no difference in the
estimates. Bland–Altman plots (Figs 3 and 4) showed no bias in
their distribution.
Table 5 summarises the reproducibility of the estimates of
LVEF from data acquired on the two cameras. There were 40
patients in which the SDs of the three estimates of the LVEFs
were above the 95th percentile for both methods on both cameras.
In most of these patients, two of the three estimates obtained on
one camera for a method were similar. The difference between
the two similar estimates (minimum difference) was 0% in 14
patients, 1% in 10 patients, 2% in 10 patients, 3% in one patient,
4% in two patients, 5% in two patients, and 6% in one patient.
The difference between the highest and lowest estimates
(maximum difference) for both cameras for both methods was
1% in one patient, 4% in three patients, 5% in three patients, 6%
in 14 patients, 7% in eight patients, 8% in four patients, 9% in
three patients, 10% in one patient, 13% in one patient, 22% in
one patient, and 33% in one patient. The differences of 22 and
33% were found in patients who were imaged on the Siemens
camera and processed by the Siemens method. In both of these
patients, it was documented by the operator that the tracking of
the left ventricle was poor.
Discussion
There is consensus in the literature that different softwareprograms
for processing GBP studies cannot be used interchangeably.
3-7
Table 3. Estimates of lvefs acquired on different
cameras processed by the Siemens method
GE camera
Siemens camera
Mean (%)
SD Range (%) Mean (%)
SD Range (%)
58.7
10.4 4.0–84.3 57.9% 10.3 13.3–84.7
There was no difference between acquisitions on different cameras (GE
and Siemens) processed by the Siemens method (F 0, 47; df 1, 37;
p
=
0.49).
Table 4. Estimates of lvefs acquired on different
cameras processed by the Hermes method
GE camera
Siemens camera
Mean (%)
SD Range (%) Mean (%)
SD Range (%)
54.3
10.2
9.3–79
53.9
10.1
7–86.3
There was no difference between acquisitions on different cameras (GE
and Siemens) processed by the Hermes method (F 0, 0.8; df 1, 368;
p
=
0.77).
Table 5. Percentiles of the sds of the three estimates
of lvefs for the GE and Siemens cameras
GE camera
Siemens camera
Siemens
method
Hermes
method
Siemens
method
Hermes
method
5th percentile
0.0
0.0
0.0
0.0
25th percentile
0.6
0.6
0.6
0.6
50th percentile
0.6
1.0
0.6
1.0
75th percentile
1.2
1.7
1.2
1.5
95th percentile
2.3
3.0
3.1
2.9
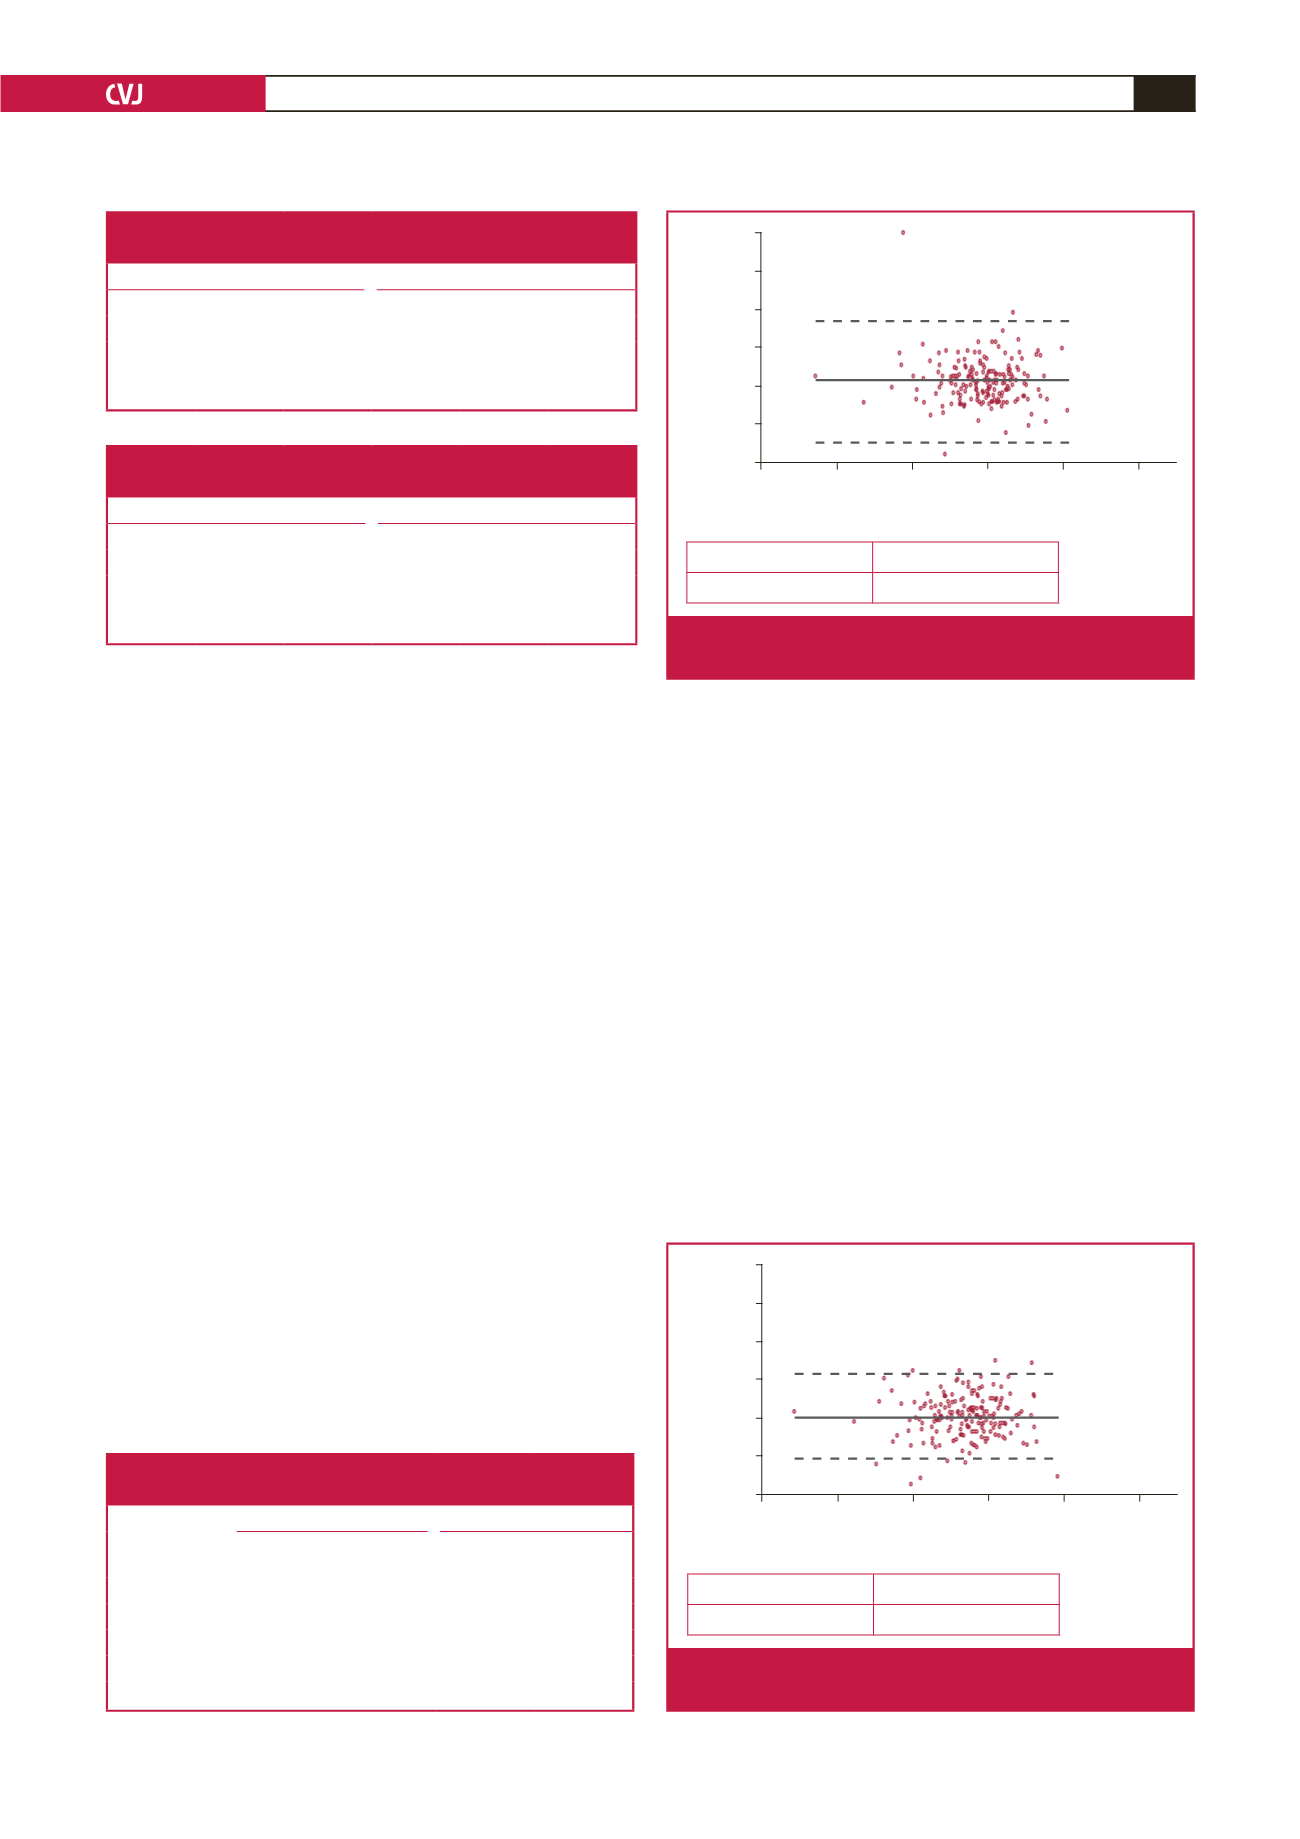
Limits of agreement (LOA)
–15.367 to 16.661
Mean difference
0.647 (CI: –0.508 to 1.802)
40.0
30.0
20.0
10.0
0.0
–10.0
–20.0
0.0 20.0 40.0 60.0 80.0 100.0
Mean LVEF (%)
Difference (camera 1 – camera 2)
Upper LOA
Mean
difference
Lower LOA
Fig. 3.
Bland–Altman plot: difference between cameras,
Siemans method
Limits of agreement (LOA)
–10.666 to 11.415
Mean difference
0.374 (CI: –0.422 to 1.171)
40.0
30.0
20.0
10.0
0.0
–10.0
–20.0
0.0 20.0 40.0 60.0 80.0 100.0
Mean LVEF (%)
Difference (camera 1 – camera 2)
Upper LOA
Mean
difference
Lower LOA
Fig. 4.
Bland–Altman plot: difference between cameras,
Hermes method


