


 14 / 72

CARDIOVASCULAR JOURNAL OF AFRICA • Volume 27, No 2, March/April 2016
68
AFRICA
and QTc interval, the former two maintained their statistical
significance (
p
<
0.001 each), while the latter two lost their
prediction of PPCM (
p
>
0.05 for each). The addition of serum
sodium or potassium levels to the models with heart rate and
ST–T-wave abnormalities did not influence the results, as the
two ECG variables maintained their predictive value (
p
<
0.001),
although serum potassium exerted greater influence than sodium
levels. Therefore after controlling for confounding variables,
including serum sodium and potassium levels, a rise in heart rate
of one beat/min increased the risk of PPCM 6.4% (
p
=
0.001),
while the presence of ST–T-wave changes increased the odds of
PPCM 12.06-fold (
p
<
0.001).
Relationship between ECG and echocardiographic
variables
The patients were evaluated echocardiographically. Mean
end-diastolic and end-systolic dimensions (LVEDD and LVESD,
respectively), LV end-systolic volume index (LVESVI) and LV
ejection fraction (LVEF) were 61.4
±
8.8 mm, 51.0
±
9.1 mm,
85.1
±
33.1 ml/m
2
and 34.4
±
9.9%, respectively. The relationship
between these echocardiographic and ECG variables are
presented in Table 4, which shows that QRS duration was the
only variable that modestly correlated with LV dimensions and
LVESVI, and showed a trend towards a significant relationship
with LVEF (
r
=
–0.27;
p
=
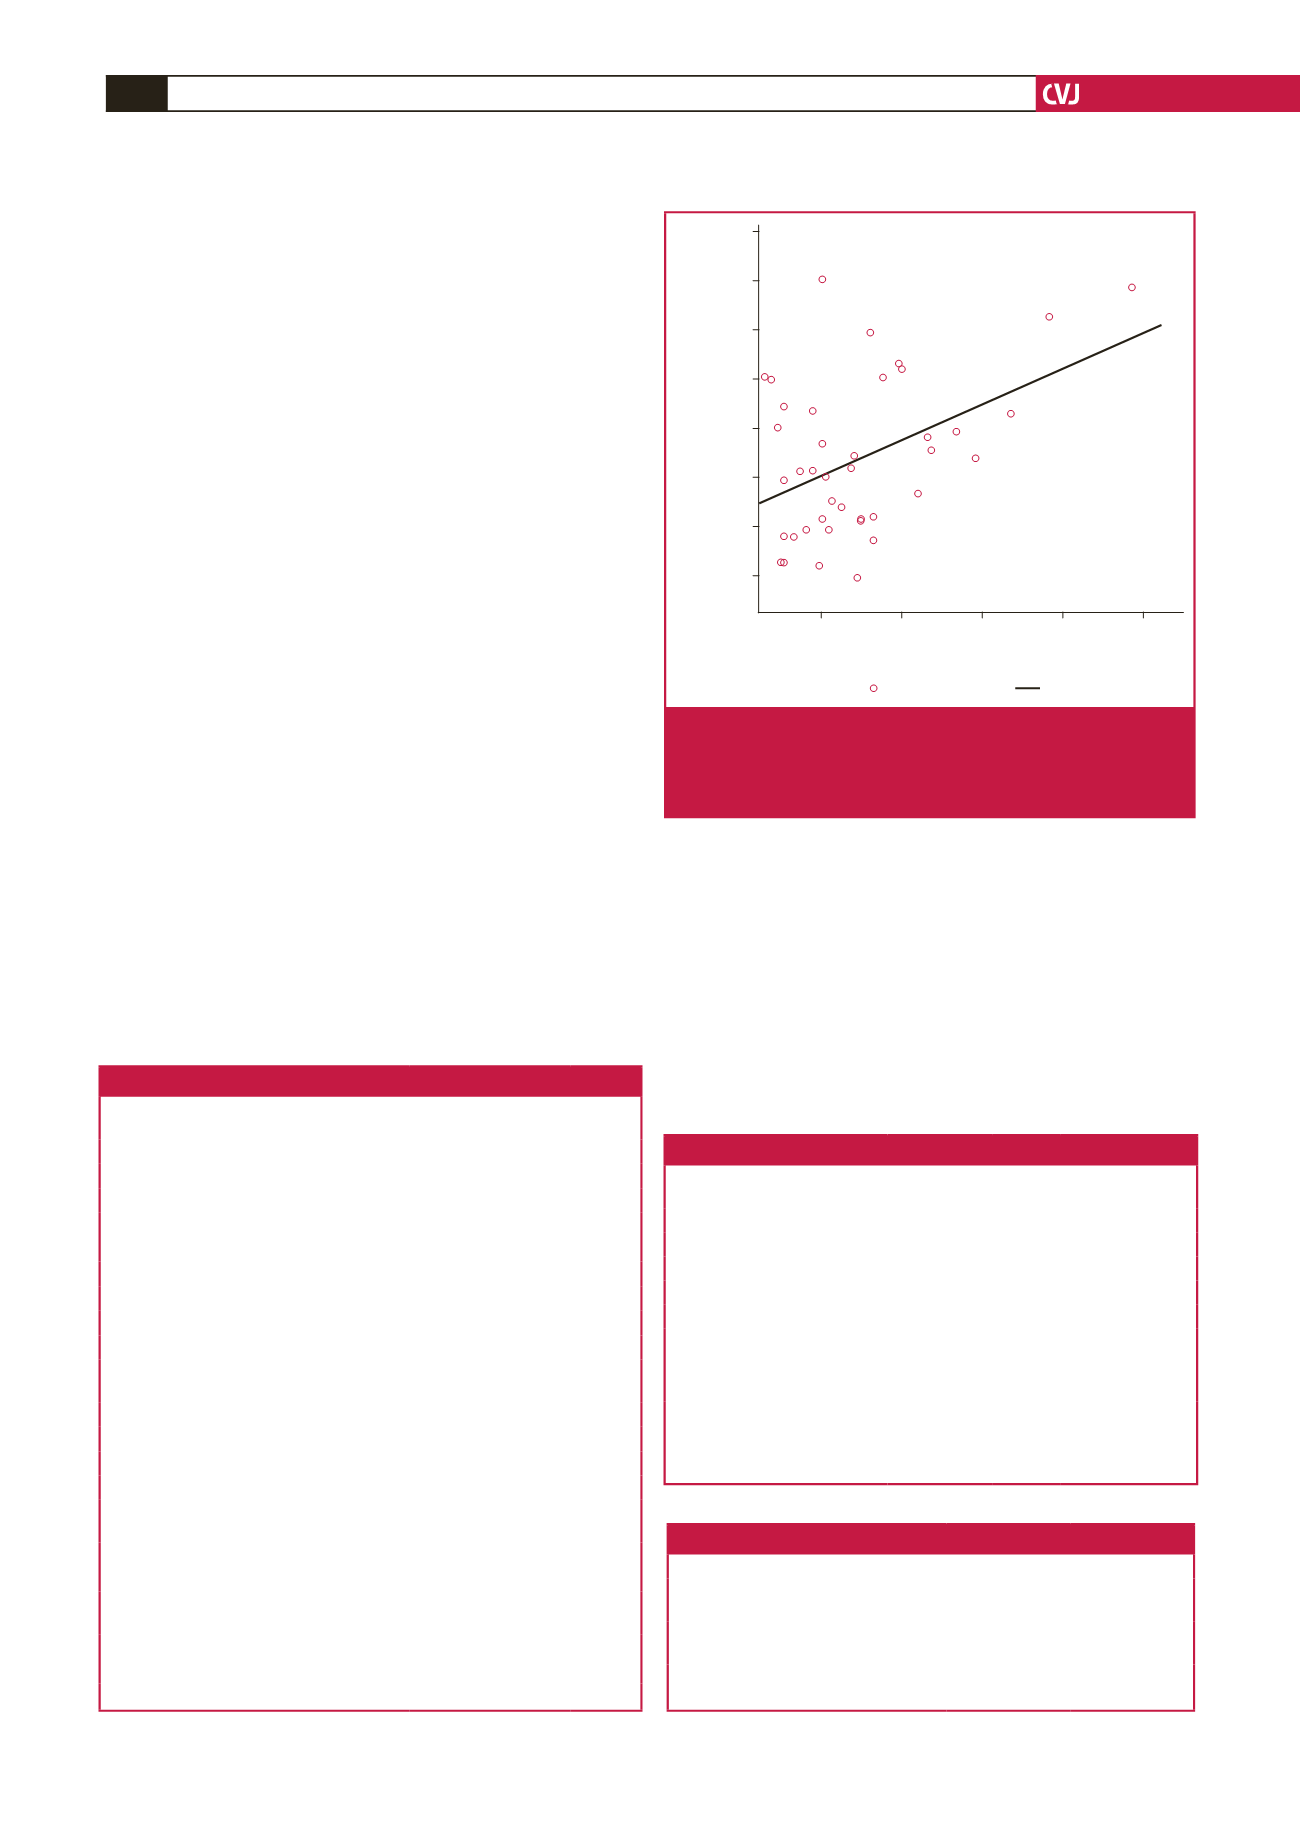
0.065). Fig. 1 shows the relationship
between QRS duration and LVESVI, which was responsible for
19.9% of its variability (
R
2
=
0.199;
p
=
0.003).
ECG risk score for PPCM
Three variables, namely tachycardia, ST–T-wave abnormalities
and QRS duration, were included in the risk score, counting 1
for each if present and 0 if absent (see Table 5). Tachycardia was
defined as heart rate
>
100 beats/min, ST–T-wave abnormalities
as T-wave inversion with or without ST-segment depression in
all leads except aVR, V1 and V2, and broad QRS duration
>
110
ms. A total of 46 patients and 27 controls had a score of
≥
2. This
score had a sensitivity of 85.2%, specificity of 64.9%, positive
predictive value (PPV) of 67.7%, negative predictive value (NPV)
of 86.2% and AUC of 83.8% (CI
=
76.4–91.2%;
p
<
0.0001) (see
Fig. 2) for predicting PPCM.
Table 3. Binary logistic regression models for predictors of PPCM
Variables
Odds
ratio 95% CI
p
-value
Univariate analysis
ECG heart rate, beats/min
1.078 1.048–1.109
<
0.001*
QRS duration, ms
1.038 1.013–1.065 0.003*
QTc interval, ms
1.036 1.019–1.054
<
0.001*
Normal heart rate
0.103 0.044–0.241
<
0.001*
QRS
≥
110 ms
5.241 2.057–13.355 0.001*
QTc
≥
460 ms
9.471 2.548–35.199 0.001*
ST–T-wave abnormalities
11.970 5.160–22.770
<
0.001*
Multivariate analyses
A (included variables: heart rate, QRS,
QTc, ST–T-wave abnormalities)
ECG heart rate, beats/min
1.073 1.036–1.112
<
0.001*
ST–T-wave abnormalities
14.591 4.581–46.480
<
0.001*
QRS duration, ms
1.028 0.994–1.062 0.105
QTc interval, ms
1.014 0.993–1.035 0.202
B (included variables: heart rate, ST-T-
wave abnormalities, serum potassium level)
ECG heart rate, beats/min
1.066 1.029–1.104
<
0.001*
ST-T-wave abnormalities
12.056 3.507–4.443
<
0.001*
C (included variables: heart rate, ST-T-
wave abnormalities, serum sodium level)
ECG heart rate, beats/min
13.415 4.203–42.825
<
0.001*
ST–T-wave abnormalities
1.064 1.029–1.101
<
0.001*
*
p
-value statistically significant; ECG, electrocardiogram.
Table 4. Correlation between ECG and echocardiographic variables
ST
–
T-wave
abnormalities
ECG
QRS
ECG
QT
ECG
HR
LVESD Pearson correlation +0.033 +0.446 +0.096 +0.109
p
-value
0.822
0.002* 0.515 0.460
LVEDD Pearson correlation +0.072 +0.420 +0.073 +0.039
p
-value
0.624
0.003* 0.624 0.793
LVEF Pearson correlation +0.015 –0.268 +0.009 –0.231
p
-value
0.920
0.065 0.949 0.115
LVESVI Pearson correlation +0.012 +0.446 +0.065 +0.095
p
-value
0.936
0.003* 0.685 0.553
*
p
-value statistically significant; ECG, electrocardiogram; HR, heart rate;
LVESD, left ventricular end-systolic dimension; LVEDD, left ventricular
end-diastolic dimension; LVEF, left ventricular ejection fraction; LVESVI,
left ventricular end-systolic volume index.
Table 5.The ECG risk score for PPCM
ECG variable
Value
Score
Heart rate, beats/min
<
100
≥
100
0
1
ST–T-wave abnormalities
Absent
Present
0
1
QRS duration, ms
<
110
≥
110
0
1
180
160
140
120
100
80
60
40
100
125
150
175
200
ECG QRS
LVESVI
Observed
Linear
Fig. 1.
Relationship between QRS duration and LV end-
systolic volume index.
R
2
=
0.199; B
=
0.571 (CI
=
0.200–0.943);
p
=
0.003. LVESVI, left ventricular end-
systolic volume index.