


 44 / 80

CARDIOVASCULAR JOURNAL OF AFRICA • Volume 28, No 3, May/June 2017
178
AFRICA
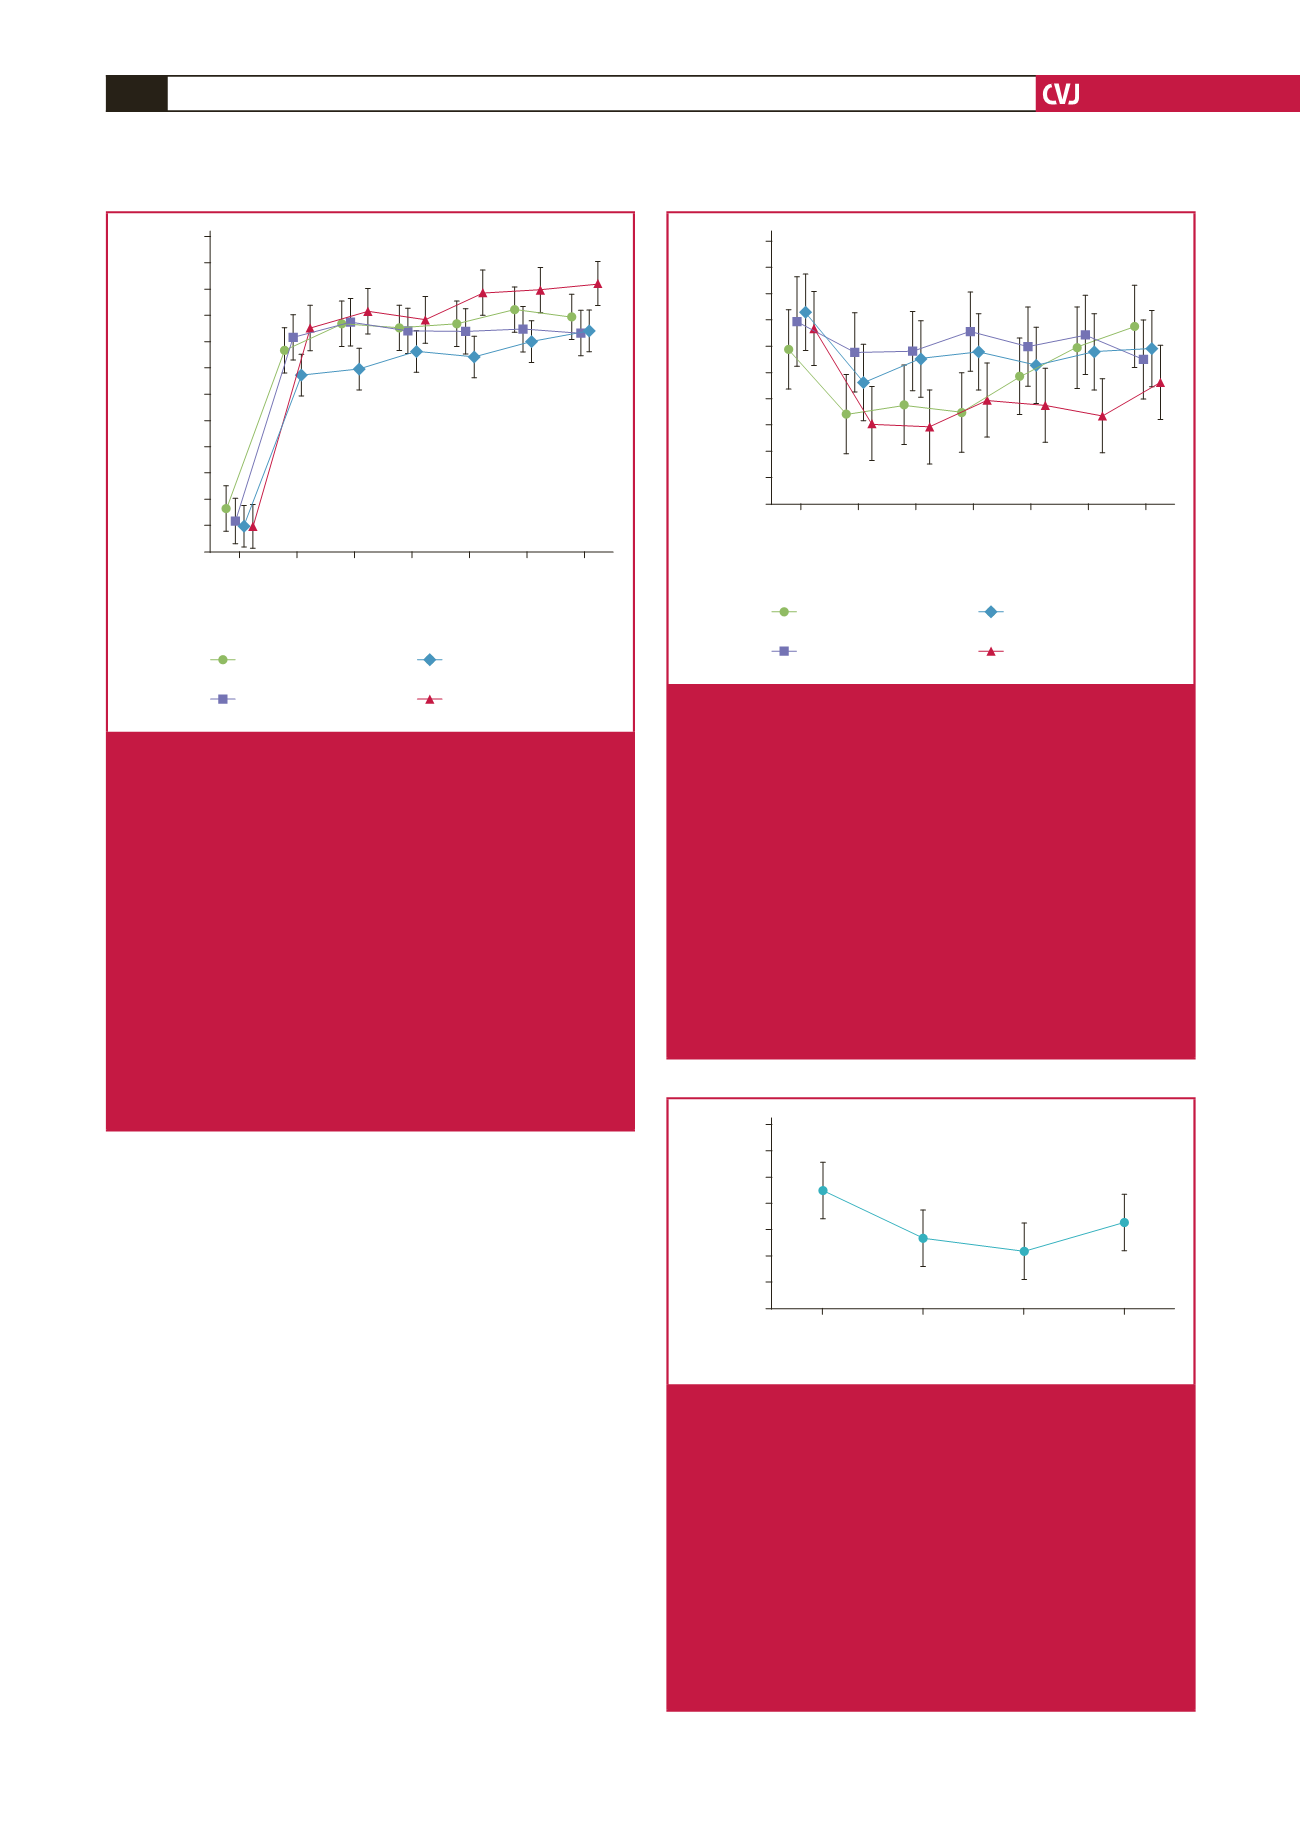
Discussion
The objective of this study was to evaluate the effects of RIF
on HR and oxy-sat data, determined at rest and during a
sub-maximal field test in healthy, untrained boys fasting for the
first time in their lives during Ramadan 2012. With regard to
HR, R-4 values were lower than those of pre-R (second minute),
R-2 (first and second minutes) and post-R (first, second, fourth,
fifth and sixth minutes), with no significant difference between
the four testing phases in resting and third-minute HR values.
Concerning oxy-sat, R-2 values were higher than those of pre-R
(third minute) and post-R (fifth minute), and post-R values were
lower than those of pre-R and R-4 (fifth minute).
To the best of our knowledge, only four studies
11-14
have
recently described the effects of RIF on the exercise performance
of healthy children. Our study included boys who lived in Kalaa-
Kebira (Sousse region), a small town on the Tunisian east coast,
known to have a low level of pollution. Fenneni
et al
.
26
criticised
these four articles and recommended studies focusing on the
effect of RIF on physiological parameters such as HR and
oxy-sat. They discussed in detail the required sample size, study
design, 6MWT choice and procedures.
26
95
90
85
80
75
70
65
60
55
50
45
40
35
Rest 1st
2nd 3rd 4th 5th 6th
ns aeg aceg ns ag ag afg
6MWT timing (min)
Heart rate (%)
pre-Ramadan (pre-R)
end of the fourth week
of Ramadan (R-4)
end of the second week
of Ramadan (R-2)
10–12 days after the end
of Ramadan (post-R)
Four testing phases:
Fig. 1.
Effect of Ramadan intermittent fasting on heart rate
determined at rest and in each minute of the six-minute
walking test (6MWT) in 18 non-athletic boys fasting for
the first time. Heart rate data is expressed as percent-
age of maximal predicted heart rate. Mean values are
shown. Error bars represent 95% confidence intervals.
ns: non-significant.
a
p
<
0.05: ANOVA between the four
testing phases for the same timing;
b
p
<
0.05 (Tukey
post hoc
test): pre-R vs R-2 for the same timing;
c
p
<
0.05 (Tukey
post hoc
test): pre-R vs R-4 for the
same timing;
d
p
<
0.05 (Tukey
post hoc
test): pre-R vs
post-R for the same timing;
e
p
<
0.05 (Tukey
post hoc
test): R-2 vs R-4 for the same timing;
f
p
<
0.05 (Tukey
post hoc
test): R-2 vs post-R for the same timing;
g
p
<
0.05 (Tukey
post hoc
test): R-4 vs post-R for the
same timing.
102
100
98
96
94
92
90
88
86
84
82
Rest 1st
2nd 3rd 4th 5th 6th
ns ns ns ab ns adfg ns
6MWT timing (min)
Oxy-sat (%)
pre-Ramadan (pre-R)
end of the fourth week
of Ramadan (R-4)
end of the second week
of Ramadan (R-2)
10–12 days after the end
of Ramadan (post-R)
Four testing phases:
Fig. 2.
Effect of Ramadan intermittent fasting on oxyhae-
moglobin saturation (oxy-sat; %) determined during
the six-minute walking test (6MWT) in 18 non-athletic
boys fasting for the first time. Mean values are shown.
Error bars represent 95% confidence intervals. ns:
non-significant.
a
p
<
0.05: ANOVA between the four
testing phases for the same timing;
b
p
<
0.05 (Tukey
post hoc
test): pre-R vs R-2 for the same timing;
c
p
<
0.05 (Tukey
post hoc
test): pre-R vs R-4 for the
same timing;
d
p
<
0.05 (Tukey
post hoc
test): pre-R vs
post-R for the same timing;
e
p
<
0.05 (Tukey
post hoc
test): R-2 vs R-4 for the same timing;
f
p
<
0.05 (Tukey
post hoc
test): R-2 vs post-R for the same timing;
g
p
<
0.05 (Tukey
post hoc
test): R-4 vs post-R for the
same timing.
80
75
70
65
60
55
50
45
Pre-R
R-2
R-4
Post-R
F (3, 53)
=
3.4191;
p
=
0.02373
Phases
6MWD x Oxy-sat (10
3
m)
ac
Fig. 3.
Effect of Ramadan intermittent fasting on the product
of oxyhaemoglobin saturation (oxy-sat) and the six-
minute walking distance (6MWD) determined during
the sixth minute of the six-minute walking test (6MWT)
in 18 non-athletic boys fasting for the first time.
Mean values are shown. Error bars represent 95%
confidence-intervals.
a
p
<
0.05: ANOVA between the
four testing phases;
b
p
<
0.05 (Tukey
post hoc
test):
pre-R vs R-2;
c
p
<
0.05 (Tukey
post hoc
test): pre-R vs
R-4;
d
p
<
0.05 (Tukey
post hoc
test): pre-R vs post-R;
e
p
<
0.05 (Tukey
post hoc
test): R-2 vs R-4;
f
p
<
0.05
(Tukey
post hoc
test): R-2 vs post-R;
g
p
<
0.05 (Tukey
post hoc
test): R-4 vs post-R.