


 54 / 80

CARDIOVASCULAR JOURNAL OF AFRICA • Volume 28, No 3, May/June 2017
188
AFRICA
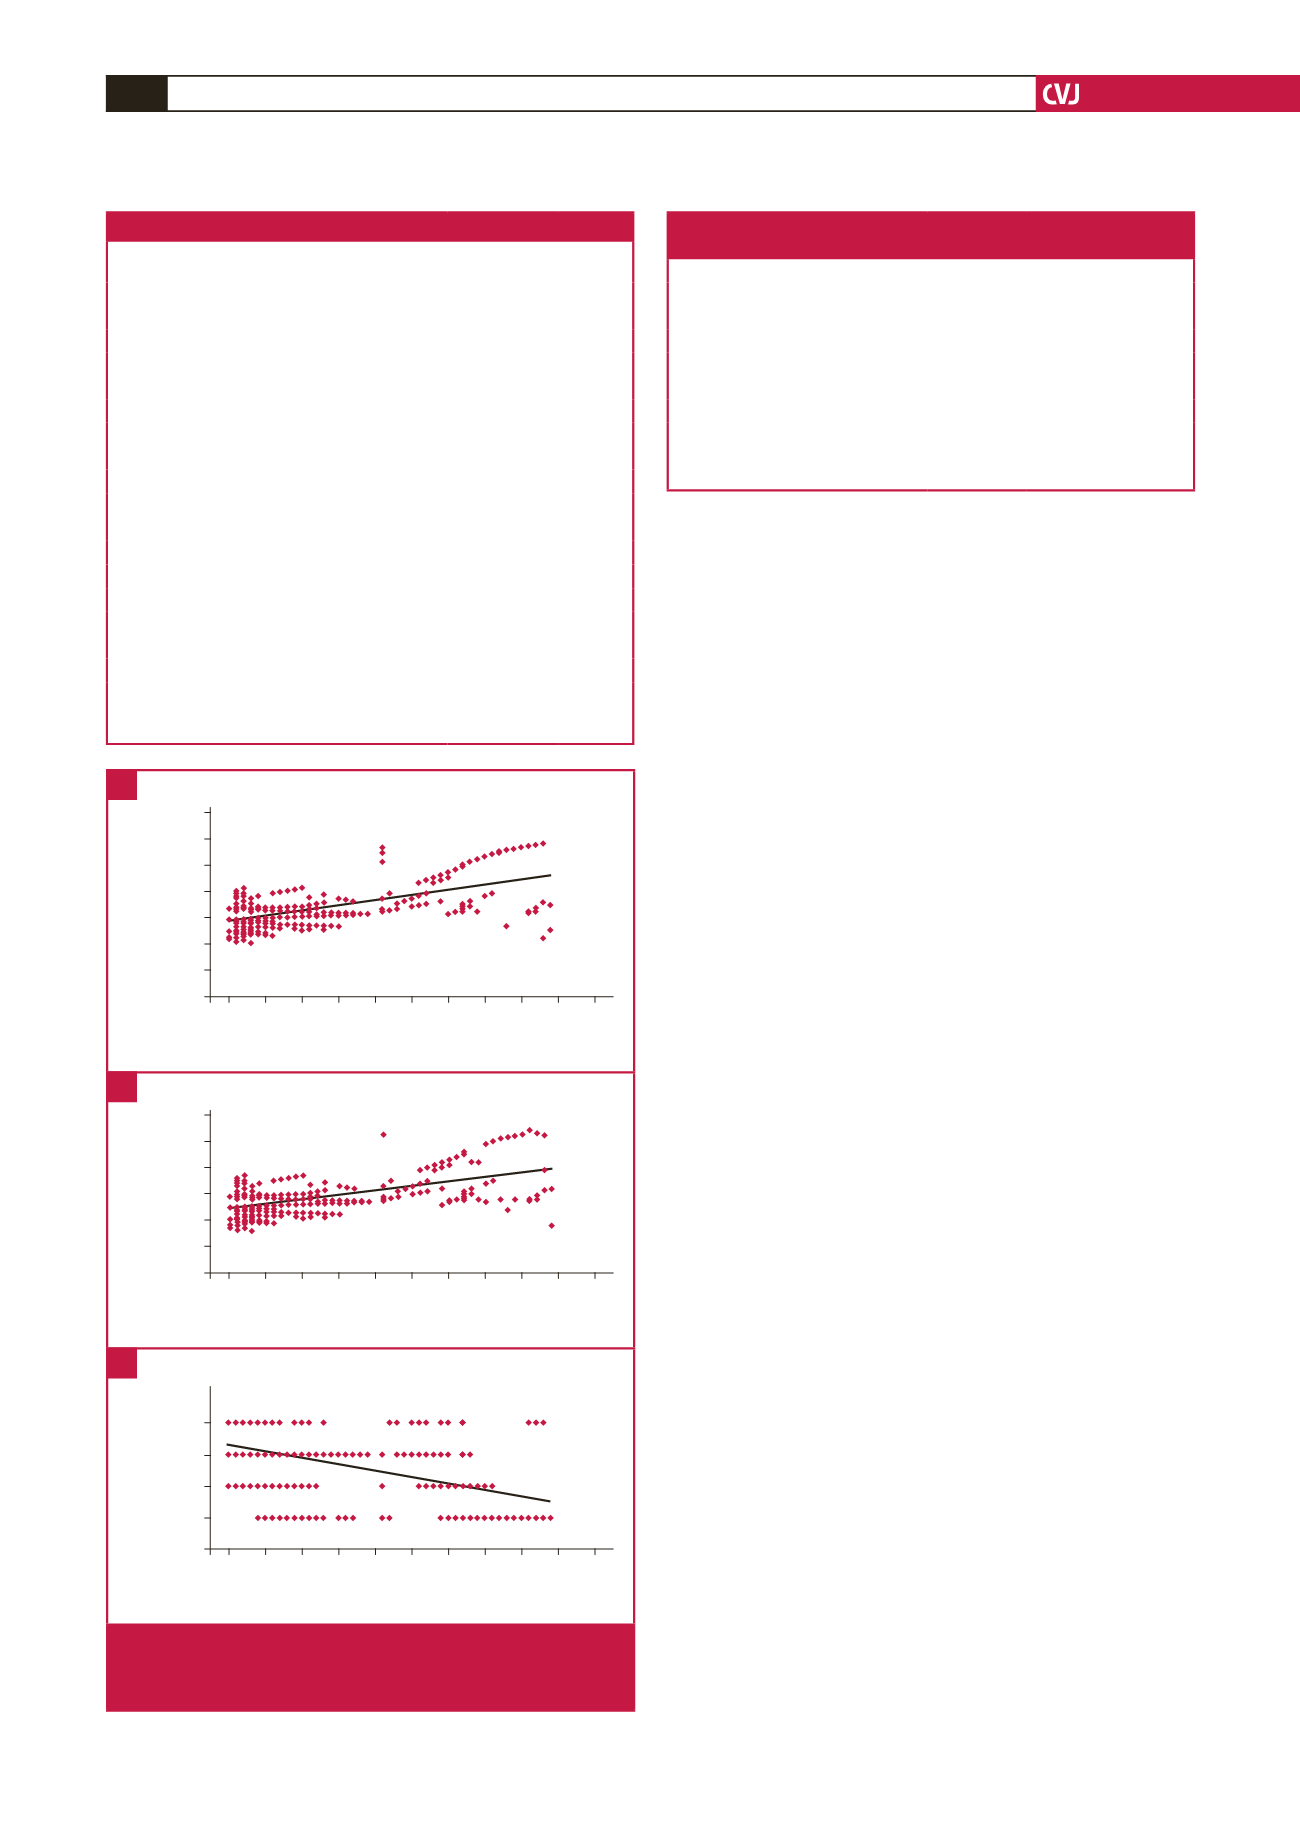
Fig. 1 shows the correlations between increase in LVEDV
and different PCI parameters. There was a significant positive
correlation between LVEDV increase and both symptom-to-
balloon time (
r
=
0.603,
p
<
0.00001, Fig. 1A) and symptom-
to-door time (
r
=
0.564,
p
<
0.00001, Fig. 1B). There was a
significant negative correlation between LVEDV increase and
MGB score (
r
=
–0.447,
p
<
0.00001, Fig. 1C).
Logistic regression for the independent predictors of LV
remodelling is shown in Table 3. The independent predictors
of LV remodelling, in order of significance, were symptom-to-
balloon time (
p
=
0.00068), symptom-to-door time (
p
=
0.0013)
and MBG (
p
=
0.0057).
Inter- and intra-observer variability for different
echocardiographic parameters ranged from 1.5 to 7.1%. For
LVEDV, inter- and intra-observer variability were 5.2
±
2.7
and 6.2
±
3.4%, respectively. For MBG score, inter- and intra-
observer variability were 2.3
±
1.1 and 4.5
±
2.4%, respectively.
Discussion
In our study, logistic regression analysis showed that the only
significant independent predictors for the occurrence of LV
remodelling were symptom-to-balloon time, symptom-to-door
time and MBG.
The great advantage of primary PCI over thrombolysis is the
earlier and the more effective restoration of coronary flow. This
in turn leads to fewer incidences of recurrent ischaemia, better
LV function, and of course better clinical outcome of STEMI
patients treated with primary PCI, compared to those treated
with thrombolysis.
3
However, even after successful restoration of blood flow in
the infarct-related artery after STEMI, a considerable number of
patients still suffer from LV dilatation and impairment in systolic
function. Among 284 STEMI patients treated with primary
PCI, Bolognese and colleagues recorded a 30% incidence of LV
remodelling, defined as
>
20% LVEDV increase.
4
This incidence
was similar to the 29.3% incidence of LV remodelling in our
study group.
Primary PCI significantly improves blood flow in epicardial
coronary arteries in STEMI patients. However, this improvement
does not always include microvascular flow and myocardial
perfusion. After restoration of blood flow in the occluded
epicardial artery, some pathophysiological changes tend to occur
and may contribute to the impairment in microcirculatory flow.
These changes include infiltration of neutrophils, endothelial
dysfunction, tissue oedema and microembolisation.
14
The relationship between microvascular dysfunction and LV
function and outcome after primary PCI has been studied by
700
600
500
400
300
200
100
0
0 5 10 15 20 25 30 35 40 45 50
Increase in LVEDV (%)
Symptom-to-balloon time
(min)
r
=
0.603
p
<
0.00001
600
500
400
300
200
100
0
0 5 10 15 20 25 30 35 40 45 50
Increase in LVEDV (%)
Symptom-to-door time
(min)
r
=
0.564
p
<
0.00001
3
2
1
0
0 5 10 15 20 25 30 35 40 45 50
Increase in LVEDV (%)
Myocardial blush
grade
r
=
0.447
p
<
0.00001
Fig. 1.
Correlations between increase in LVEDV and symp-
tom-to-balloon time (A), symptom-to-door time (B),
and MBG (C).
A
B
C
Table 3. Logistic regression analysis for independent
predictors of LV remodelling
Variables
Odds ratio
95% CI
p
-value
Symptom-to-balloon time
3.78
2.41–5.15 0.00068
Symptom-to-door time
4.61
3.01–6.21 0.0013
Myocardial blush grade
3.44
1.65–5.22 0.0057
Baseline EF
2.99
1.12–4.86
0.0744
Peak CK-MB
2.71
1.14–4.28 0.1564
Baseline LVEDV
1.3
0.63–1.97 0.253
Age
1.06
0.47–1.65 0.365
CI
=
confidence interval, LVEDV
=
left ventricular end-diastolic volume, EF
=
ejection fraction.
Table 2. PCI data
Parameters
Remodelling
(
n
=
68)
No remodelling
(
n
=
164)
p
-value
Stenting,
n
(%)
65 (95.6)
161 (98.2)
0.259
Thrombus aspiration,
n
(%)
23 (33.8)
58 (34.5)
0.823
GPIIb/IIIa inhibitors,
n
(%)
31 (45.6)
77 (46.9)
0.849
Infarct-related artery,
n
(%)
LAD
41 (60.3)
93 (56.7)
0.877
LCX
13 (19.1)
35 (21.3)
RCA
14 (20.6)
36 (22)
Multi-vessel disease,
n
(%)
22 (32.3)
50 (29.8)
0.799
Baseline stenosis (%)
95.3
±
4.61
94.7
±
5.34
0.391
Stent diameter (mm)
3.12
±
0.561 3.24
±
0.644 0.157
Stent length (mm)
15.8
±
5.74
16.3
±
6.33
0.559
Final stenosis (%)
5.76
±
4.22
6.33
±
5.11
0.381
MBG: 0
28
21
<
0.00001
MBG: 1
17
24
MBG: 2
11
52
MBG: 3
12
67
Mean MBG
1.102
±
0.913 2.001
±
1.036
<
0.00001
Data are expressed as mean
±
SD or number (%). LAD
=
left anterior descend-
ing artery, LCX
=
left circumflex artery, RCA
=
right coronary artery, MBG
=
myocardial blush grade.