


 36 / 68

CARDIOVASCULAR JOURNAL OF AFRICA • Volume 30, No 3, May/June 2019
164
AFRICA
There was no significant difference between the two groups in
terms of location, length or diameter of the target lesion, except
that the emergency PCI group had a higher rate of thrombus-
containing lesions (
p
=
0.028). The number of patients with
an initial TIMI 3 flow was similar in the two groups (43.24 vs
58.14%,
p
=
0.493).
All patients underwent angiography and stent implantation.
A significantly higher procedural success rate was achieved in the
delayed PCI group, with a 97.7% success rate, compared to an
86.3% success rate in the emergency PCI group (
p
=
0.007). This
higher procedural success rate was related to a remarkably lower
rate of no re-flow or slow flow (2.3 vs 13.7%,
p
=
0.007) during
PCI. Consequently, TIMI 3 flow was observed significantly more
frequently at the end of the procedure in the delayed PCI group
compared with the immediate PCI group (100 vs 86.3%,
p
<
0.001) (Table 3).
There was one death in the emergency PCI group due to cardiac
rupture, and two other deaths in the delayed PCI group; one
patient died of cardiac arrest and the other of cardiogenic shock.
No difference was found in in-hospital mortality rates between
the two groups (1.4 vs
2.3%,
p
=
0.562). There was no significant
difference in rate of MACE between patients who had received
emergency PCI and those in whom PCI was delayed (16.4 vs 9.3%,
p
=
0.133). The left ventricular ejection fraction was similar in the
two groups at the time of discharge, and was an average of 52%.
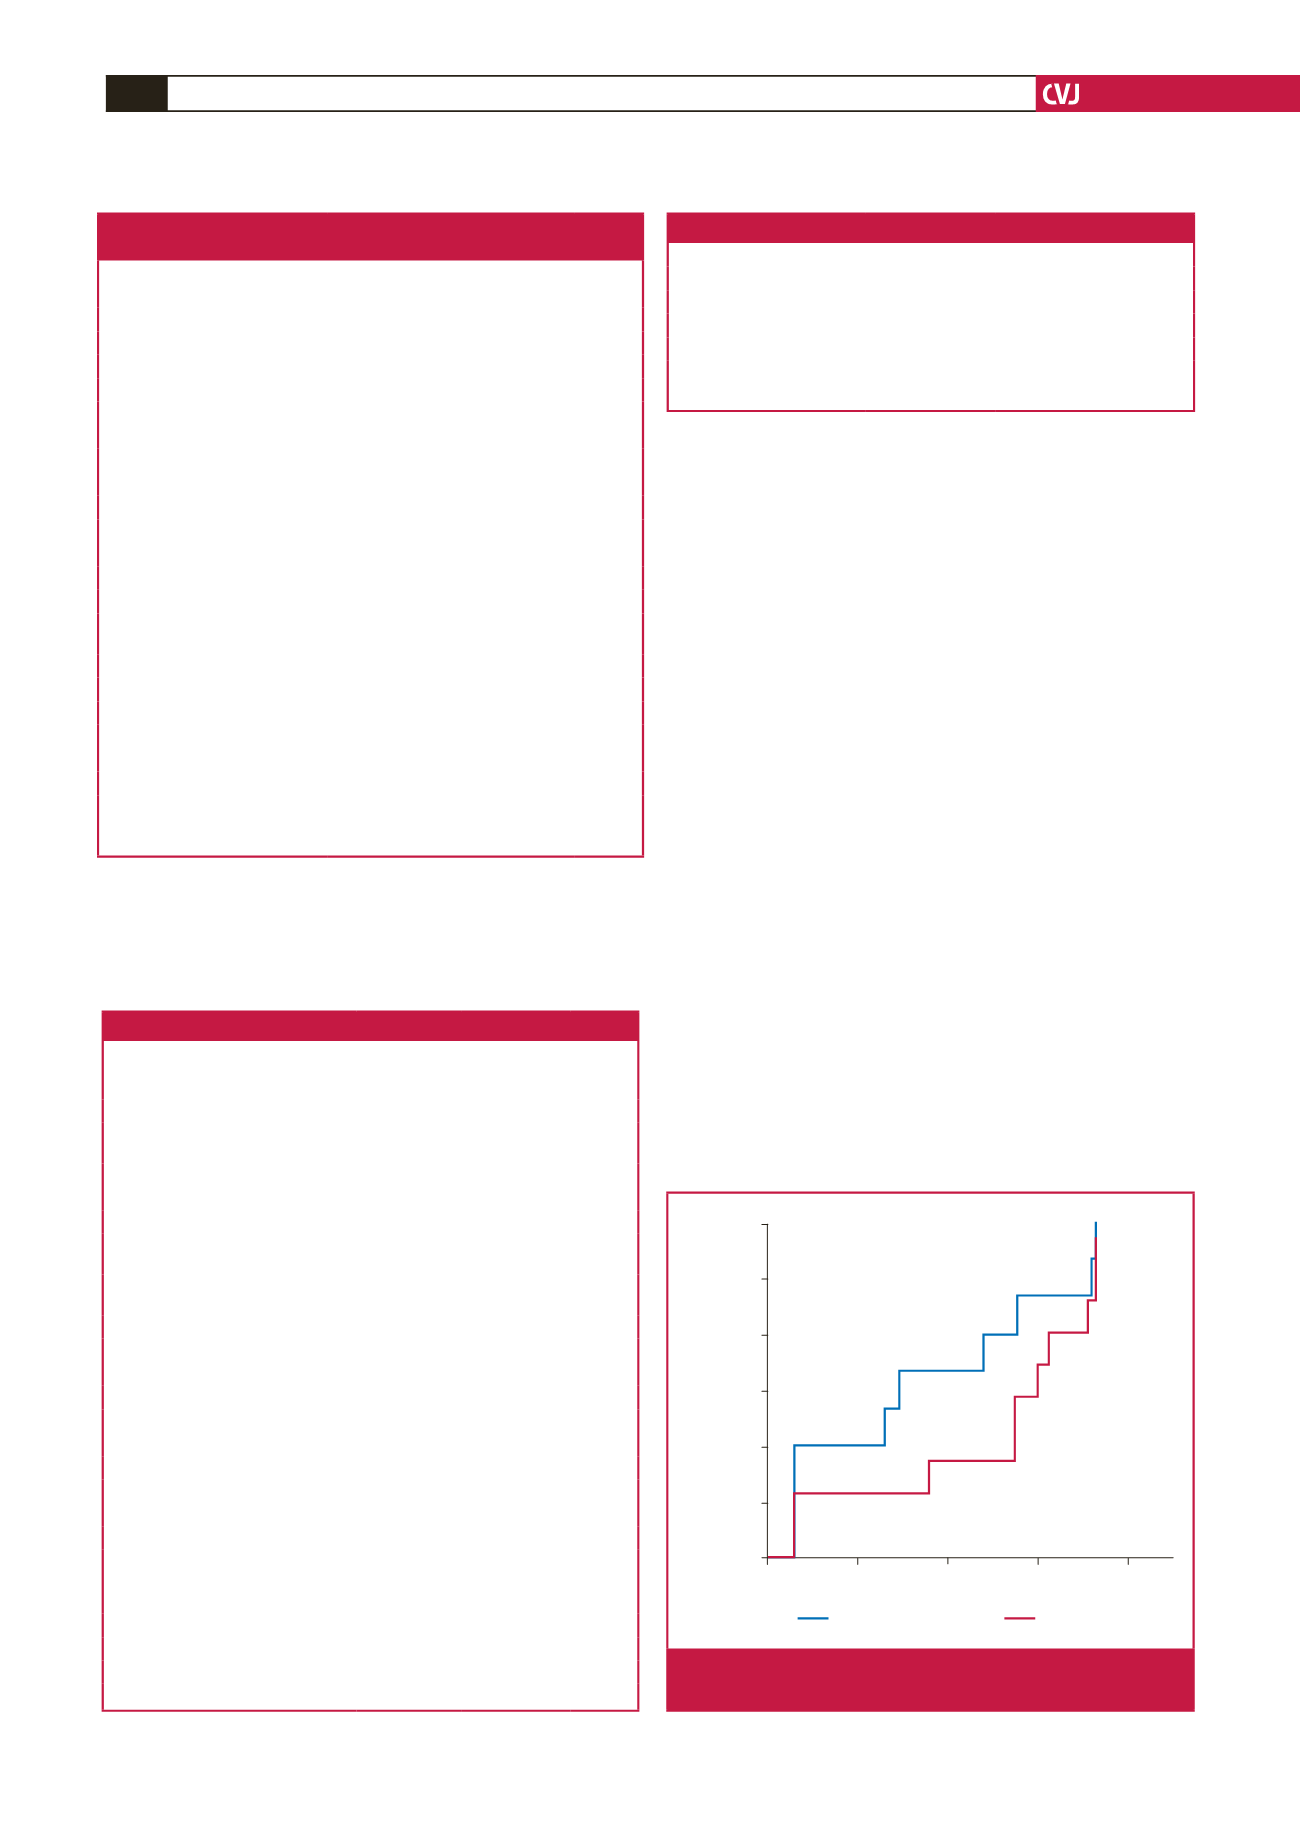
Information on one year of follow up was collected for the
remaining 156 patients. The left ventricular ejection fraction was
similar in the two groups [median 58% (57–68) in the emergency
PCI group vs median 56% (50–62) in the delayed PCI group,
p
=
0.666]. Although the emergency PCI group had a trend towards
a higher rate of MACE, the difference was not statistically
significant [12.2 vs
11.6%, hazard ratio (HR)
=
1.067, 95% CI:
0.434–2.627,
p
=
0.887] (Fig. 2).
Table 1. Baseline clinical characteristics in the emergency PCI
and the delayed PCI groups
Emergency PCI
Delayed PCI
p-
value
(
n
=
73)
(
n
=
86)
Age (year)
62.31
±
13.40
63.08
±
12.85 0.714
Gender (male),
n
(%)
60 (82.19)
65 (75.58)
0.338
Hypertension,
n
(%)
40 (54.79)
41 (47.67)
0.427
Diabetes,
n
(%)
17 (23.28)
26 (30.23)
0.37
Dyslipidaemia,
n
(%)
10 (13.7)
5 (5.81)
0.11
Smoking,
n
(%)
38 (52.05)
44 (51.16)
1.00
SBP (mmHg)
141.31
±
27.40
130
±
23.16
0.052
DBP (mmHg)
81.22
±
16.59
74.44
±
13.50 0.218
Pulse (bpm)
79.61
±
15.27
81.41
±
20.25
0.74
hs-CRP,
n
(median) (mmol/l)
6.58 (0.48–114.7) 9.87 (0.42–68.77) 0.022*
Peak CK-MB,
n
(median) (U/l)
63 (6–544)
37 (6–546)
0.10
Creatine,
n
(median) (µmol/l)
83 (36–188)
81 (46–378)
0.921
Uric acid (mmol/l)
372.49
±
102.05 355.88
±
118.06 0.293
Fasting glucose,
n
(median)
(mmol/l)
5.6 (3.86–17.56) 5.96 (3.81–23.11) 0.038*
LDL-C,
n
(median) (mmol/l)
2.96 (0.99–6.05)
2.7 (1.23–6.46)
0.4
Serum potassium (mmol/l)
3.88
±
0.38
3.94
±
0.46
0.386
Killip 1,
n
(%)
58 (79.45%)
71 (82.56%)
0.686
Anterior wall infarction,
n
(%)
51 (69.86%)
52 (60.46%)
0.246
Time from onset to admission (h)
24 (12–72)
26.5 (12–72)
0.012*
Time from onset to PCI (h)
24 (12–72)
192 (20–480)
<
0.001*
SBP: systolic blood pressure; DBP: diastolic blood pressure; hs-CRP: high-sensi-
tivity C-reactive protein; LDL-C: low-density lipoprotein cholesterol; LVEF: left
ventricular ejection fraction; *
p
<
0.05.
Table 2. Baseline angiographic and procedural data in the two groups
Emergency
PCI
(
n
=
73)
Delayed
PCI
(
n
=
86)
p-
value
Symptoms pre-PCI,
n
(%)
Most recent chest pain within 12
hours of admission
27 (36.9)
16 (18.6)
0.012*
Antiplatelet therapy,
n
(%)
Loading dose of aspirin
73 (100)
86 (100)
1.00
Loading dose of clopidogrel
73 (100)
86 (100)
1.00
Routine dose of aspirin > 1 day
pre-PCI
8 (10.9)
81 (94.2)
<
0.001*
Routine dose of clopidogrel
> 1 day pre- PCI
0 (0)
81 (94.2)
<
0.001*
Other antithrombotic therapy,
n
(%)
Thrombolytic therapy before PCI
0 (0)
3 (34.9)
0.25
GPIIb/IIIa pre-PCI
18 (24.6)
4 (4.7)
<
0.001*
LMWH use pre-PCI
6 (8.2)
86 (100)
<
0.001*
IRA lesion site,
n
(%)
0.099
Right coronary artery
15 (20.5)
30 (34.9)
Left anterior descending
52 (71.2)
47 (54.7)
Circumflex artery
7 (9.6)
9 (10.5)
Characteristics of the target lesion
Length of target lesion (mm)
24 (14–69)
30 (12–72)
0.063
Diameter of target lesion (mm)
3.25 (2.3–4.0) 3.14 (2.25–4.0)
0.24
Stenosis degree of target lesion
(median) (%)
99 (80–99)
95 (70–99)
0.001*
Thrombus-containing lesion,
n
(%)
17 (23.3)
8 (9.3)
0.027*
TIMI flow degree,
n
(%)
Initial TIMI 3 flow
32 (43.8)
50 (58.1)
0.081
IRA: infarct related artery. *
p
<
0.05.
Table 3. Final angiographic and procedural data after PCI
Emergency PCI
Delayed PCI
p-
value
(
n
=
73)
(
n
=
86)
PCI,
n
(%)
73 (100)
86 (100)
1
Final TIMI 3,
n
(%)
63 (86.3)
86 (100)
<
0.001
Slow flow/no re-flow,
n
(%)
10 (13.7)
2 (2.3)
0.007
Procedure success rate,
n
(%)
63 (86.3)
84 (97.7)
0.007
*
p
<
0.05
Days
Emergency group
Delayed group
0
100
200
300
400
Rate of MACE
0.12
0.10
0.08
0.06
0.04
0.02
0.00
11.6%
12.2%
Fig. 2.
MACE during one year of follow up in emergency
versus delayed PCI group.