


 14 / 64

CARDIOVASCULAR JOURNAL OF AFRICA • Volume 30, No 4, July/August 2019
200
AFRICA
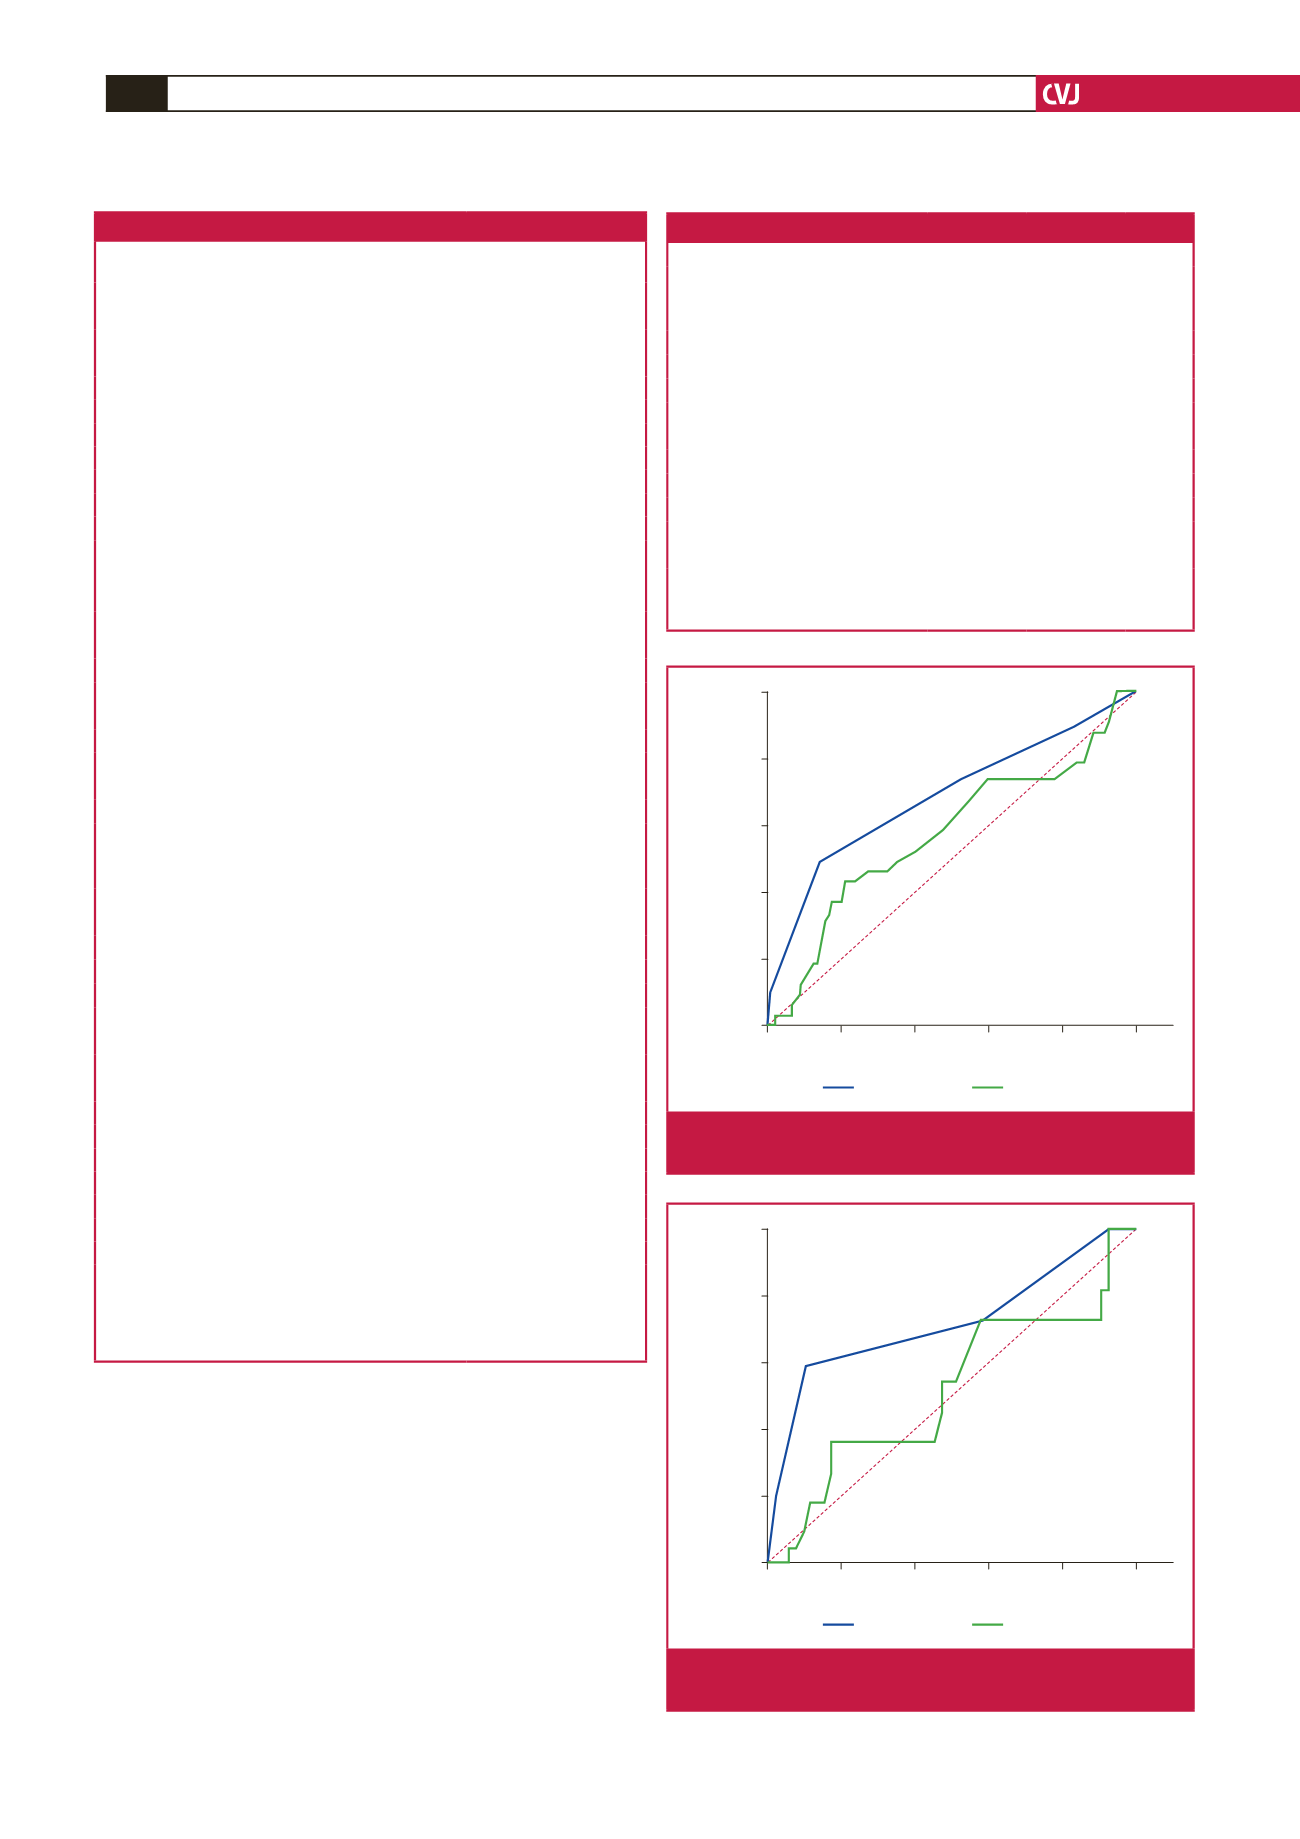
sensitivity of the HAS-BLED score was 59.09% and specificity
was 89.81% in the subgroup with stenting.
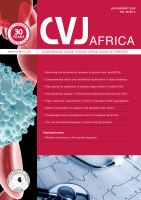
According to the ROC curve analysis, the HAS-BLED score
was found to be statistically significantly predictive of in-hospital
bleeding in patients who underwent stenting due to stable coronary
artery disease (
p
=
0.0012). In the same patient group, the
sensitivity of the CRUSADE score was 36.36% and the specificity
was 82.69%, but it was not statistically significant (
p
=
0.789).
Discussion
The main finding of this study was that patients with
stable coronary artery disease undergoing elective coronary
100 – Specificity
0
20
40
60
80
100
Sensitivity
100
80
60
40
20
0
HAS-BLED AUC = 684
CRUSADE AUC = 569
p
=
0.002
HAS-BLED
CRUSADE
Fig. 1.
Comparison of ROC curves in all patients undergoing
coronary angiography.
Table 1. Baseline characteristics and laboratory findings of the two groups
Variables
Bleeding
(
n
=
65)
No bleeding
(
n
=
340)
p
-value
Baseline characteristics
Age (years), mean (SD)
65.32
±
11.40 60.01
±
13.57 0.003*
Gender (female),
n
(%)
36 (55.4)
157 (46.2)
0.173
Current smoker,
n
(%)
13 (20)
104 (30.6)
0.084
Hypertension,
n
(%)
32 (49.23)
149 (43.8)
0.421
Vascular disease,
n
(%)
8 (12.3)
20 (5.9)
0.061
Coronary artery disease,
n
(%)
22 (33.8)
123 (36.2)
0.720
Diabetes mellitus,
n
(%)
8 (12.3)
115 (33.8)
0.001*
Congestive heart failure,
n
(%)
6 (9.2)
18 (5.3)
0.218
Cerebrovascular disease,
n
(%)
5 (7.6)
12 (3.5)
0.177
Body mass index (kg/m
2
)
28.51
±
3.69 28.43
±
4.24 0.882
Systolic blood pressure (mmHg)
128.30
±
14.96 130.33
±
19.23 0.421
Diastolic blood pressure (mmHg)
76.24
±
12.28 77.39
±
13.19 0.517
Heart rate (beats/min)
78.26
±
13.79 75.26
±
10.55 0.101
Angiographic characteristics
Stenting
22 (33.8)
108 (31.7)
0.741
Opaque amount (cm
3
)
76.53
±
55.57 70.13
±
53.62 0.382
Duration of angiography (min)
22.36
±
21.51 18.21
±
12.07 0.135
Femoral artery intervention,
n
(%)
44 (67.6)
233 (68.5)
0.894
Unfractionated heparin bolus,
n
(%)
24 (36.9)
110 (32.4)
0.473
Tirofiban bolus,
n
(%)
2 (3.1%)
12 (3.5)
0.855
Laboratory findings
Sodium (mmol/dl; SD)
139.20
±
2.61 138.33
±
8.63 0.424
Potassium (mmol/dl; SD)
4.28
±
0.36
4.47
±
0.45
<
0.001*
Creatinine (mg/dl; SD)
(mmol/l)
0.75
±
0.24
(66.3
±
21.22)
0.82
±
0.23
(72.49
±
20.33)
0.059
Urea (mg/dl; SD)
37.05
±
10.05 34.73
±
14.76 0.226
WBC (× 10
3
/µl; SD)
7.36
±
2.02
7.84
±
5.09 0.454
Haemoglobin (g/dl; SD)
14.27
±
5.39 14.11
±
1.76 0.816
Haematocrit,
n
(%; SD)
40.61
±
4.58 42.78
±
4.46
<
0.001*
Platelets (×10
3
/µl; SD)
258.85
±
65.24 263.16
±
78.07 0.686
TSH (µIU/ml)
2.48
±
4.43
1.96
±
3.19 0.318
International normalised ratio
1.05
±
0.10
1.03
±
0.11 0.174
Drugs
Clopidogrel,
n
(%)
32 (49.2)
133 (39.1)
0.128
Oral anticoagulant
n
(%)
2 (3.1)
4 (1.2)
0.245
Acetylsalicylic acid,
n
(%)
40 (61.5)
215 (63.2)
0.795
Beta-blocker,
n
(%)
26 (40)
141 (41.5)
0.825
RAAS blockers,
n
(%)
22 (33.8)
106 (31.2)
0.671
Calcium channel blockers,
n
(%)
8 (12.3)
37 (10.9)
0.738
Diuretics,
n
(%)
10 (15.4)
27 (7.9)
0.056
Nitrate
8 (12.3)
29 (8.5)
0.333
*Independent samples
t
-test, chi-squared test, Fisher’s exact test; *
p
<
0.05 statisti-
cally significant. Continuous variables are reported as mean
±
SD. Categorical
variables are reported as
n
(%).
WBC, white blood cells; RAAS, renin–angiotensin–aldosterone system; NSAID,
non-steroidal anti-inflammatory drugs; TSH, thyroid-stimulating hormone.
Table 2. Bleeding scores
Risk scores
Bleeding
No bleeding
p
-value
Bleeding scores of all patients who
underwent coronary angiography
(
n
=
65)
(
n
=
340)
HAS-BLED
2.21
±
1.15 1.49
±
0.95
<
0.001*
CRUSADE
23.69
±
11.37 21.28
±
10.82 0.105
HAS-BLED
≥
3,
n
(%)
32 (49.2)
48 (14.1)
<
0.001*
CRUSADE
>
30,
n
(%)
24 (36.9)
60 (18)
0.001*
CRUSADE
>
40,
n
(%)
2 (3.1)
18 (5.4)
0.440
Bleeding scores of stented patients
(
n
=
22)
(
n
=
108)
HAS-BLED
2.50
±
1.10 1.62
±
0.81 0.001*
CRUSADE
22.27
±
12.31 21.62
±
11.68 0.815
HAS-BLED
≥
3,
n
(%)
13 (59.1)
11 (10.2)
<
0.001*
CRUSADE
>
30,
n
(%)
8 (36.4)
22 (21.2)
0.128
CRUSADE
>
40,
n
(%)
1 (4.5)
8 (7.5)
0.616
*Independent samples
t
-test, chi-squared test;*
p
<
0.05 statistically significant.
Continues variables are reported as mean
±
SD. Categorical variables are
reported as
n
(%).
100 – Specificity
0
20
40
60
80
100
Sensitivity
100
80
60
40
20
0
HAS-BLED AUC = 0.722
CRUSADE AUC = 0.520
p
=
0.002
HAS-BLED
CRUSADE
Fig. 2.
Comparison of ROC curves in coronary stent implant-
ed patients.