


 9 / 64

CARDIOVASCULAR JOURNAL OF AFRICA • Volume 30, No 4, July/August 2019
AFRICA
195
the corresponding selected circulating markers of endothelial
dysfunction (NO, ET-1 and PAI-1) using the Spearman rank
correlation coefficient (
r
s
).
Results shown in Table 2 suggest a significant weak negative
correlation (
p
<
0.05) between the age of the study subject and
serum levels of NO, as well as a significant moderate negative
correlation between serum TIAGE and NO levels (
p
<
0.05), and
between serum CML and NO levels (
p
<
0.05) (Table 2). Table 2
also shows a significant weak positive correlation between serum
TIAGE and ET-1 levels (
p
<
0.05), as well as between serum
CML and ET-1 levels (
p
<
0.05).
Bivariate logistic regression analysis of the association between
age and gender of the diabetic subjects, as well as serum levels
of the major types of serum AGEs with endothelial dysfunction
(serum NO levels less than the first quartile) revealed that only
higher serum levels of CML were significantly associated with
higher crude odds of endothelial dysfunction [COR (95% CI),
1.910 (0.655–0.893) (
p
<
0.05) (Table 3).
Discussion
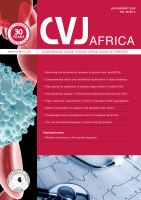
As expected, serum levels of TIAGEs, CML and CEL were
found to be significantly higher in the diabetic patient group
compared with the non-diabetic control group. However, serum
FAGE levels of diabetic patients were not significantly different
from those of non-diabetic controls. This observation might be
attributed to the nature of the control group used in the study.
High serum FAGE levels, in particular high serum levels of
pentosidine, the most abundant fluorescent AGE in plasma
and tissues, have been associated with the development and
progression of osteoporosis in diabetic and non-diabetic
Type of serum AGE
TIAGE
CML
CEL
FAGE
TIAGE ×100 (
μ
g/ml)
CML (ng/ml)
CEL (ng/ml)
Fage ×0.5 (Au)
50
45
40
35
30
25
20
15
10
5
0
Diabetic
Non-diabetic
**
**
*
Fig. 1.
Comparison of median levels of total immunogen-
ic AGEs (TIAGEs), N
ε
-carboxymethyl-lysine (CML),
N
ε
-carboxyethyl-lysine (CEL) and fluorescent AGEs
(FAGEs) between the type 2 diabetes and non-diabet-
ic control groups. *Significant at
p
<
0.01,
**
significant
at
p
<
0.001.
Table 1. Demographic, clinical and laboratory
characteristics of the study subjects
Characteristics
Type 2 diabetes
group (
n
= 120)
mean
±
SD
Non-diabetic control
group (
n
= 83)
mean
±
SD p
-value
Gender
Male,
n
(%)
49 (41)
36 (44)
0.512
Female,
n
(%)
71 (59)
47 (56)
0.734
Age (years)
56.9
±
9.4
51.1
±
9.8
0.152
FBG (mmol/l)
11.6
±
3.3
5.2
±
6.3
0.012*
HbA
1c
(%)
9.7
±
1.2
6.1
±
2.6
0.037*
HbA
1c
(mmol/mol)
81
±
0.99
43
±
5
0.037*
BMI (kg/m²)
26.6
±
4.7
25.8
±
5.5
0.081
TC (mmol/l)
4.20
±
1.80
4.03
±
0.95
0.174
LDL (mmol/l)
2.3
±
0.15
2.1
±
0.2
0.511
TG (mmol/l)
1.2
±
0.5
1.32
±
0.4
0.712
SBP (mmHg)
127
±
10.9
128
±
8.7
0.141
DBP (mmHg)
81
±
10.8
82
±
8.4
0.091
Urea (mmol/l)
6.0
±
2.5
5.6
±
1.3
0.452
Creatinine (µmol/l)
94
±
55.9
86.4
±
21.1
0.318
FBG: fasting blood glucose; HbA
1c
: glycated haemoglobin; BMI: body mass
index; TC: total cholesterol; LDL: low-density lipoprotein; TG: triglycerides;
SBP: systolic blood pressure; DBP: diastolic blood pressure; GFR: glumerular
filtration rate.
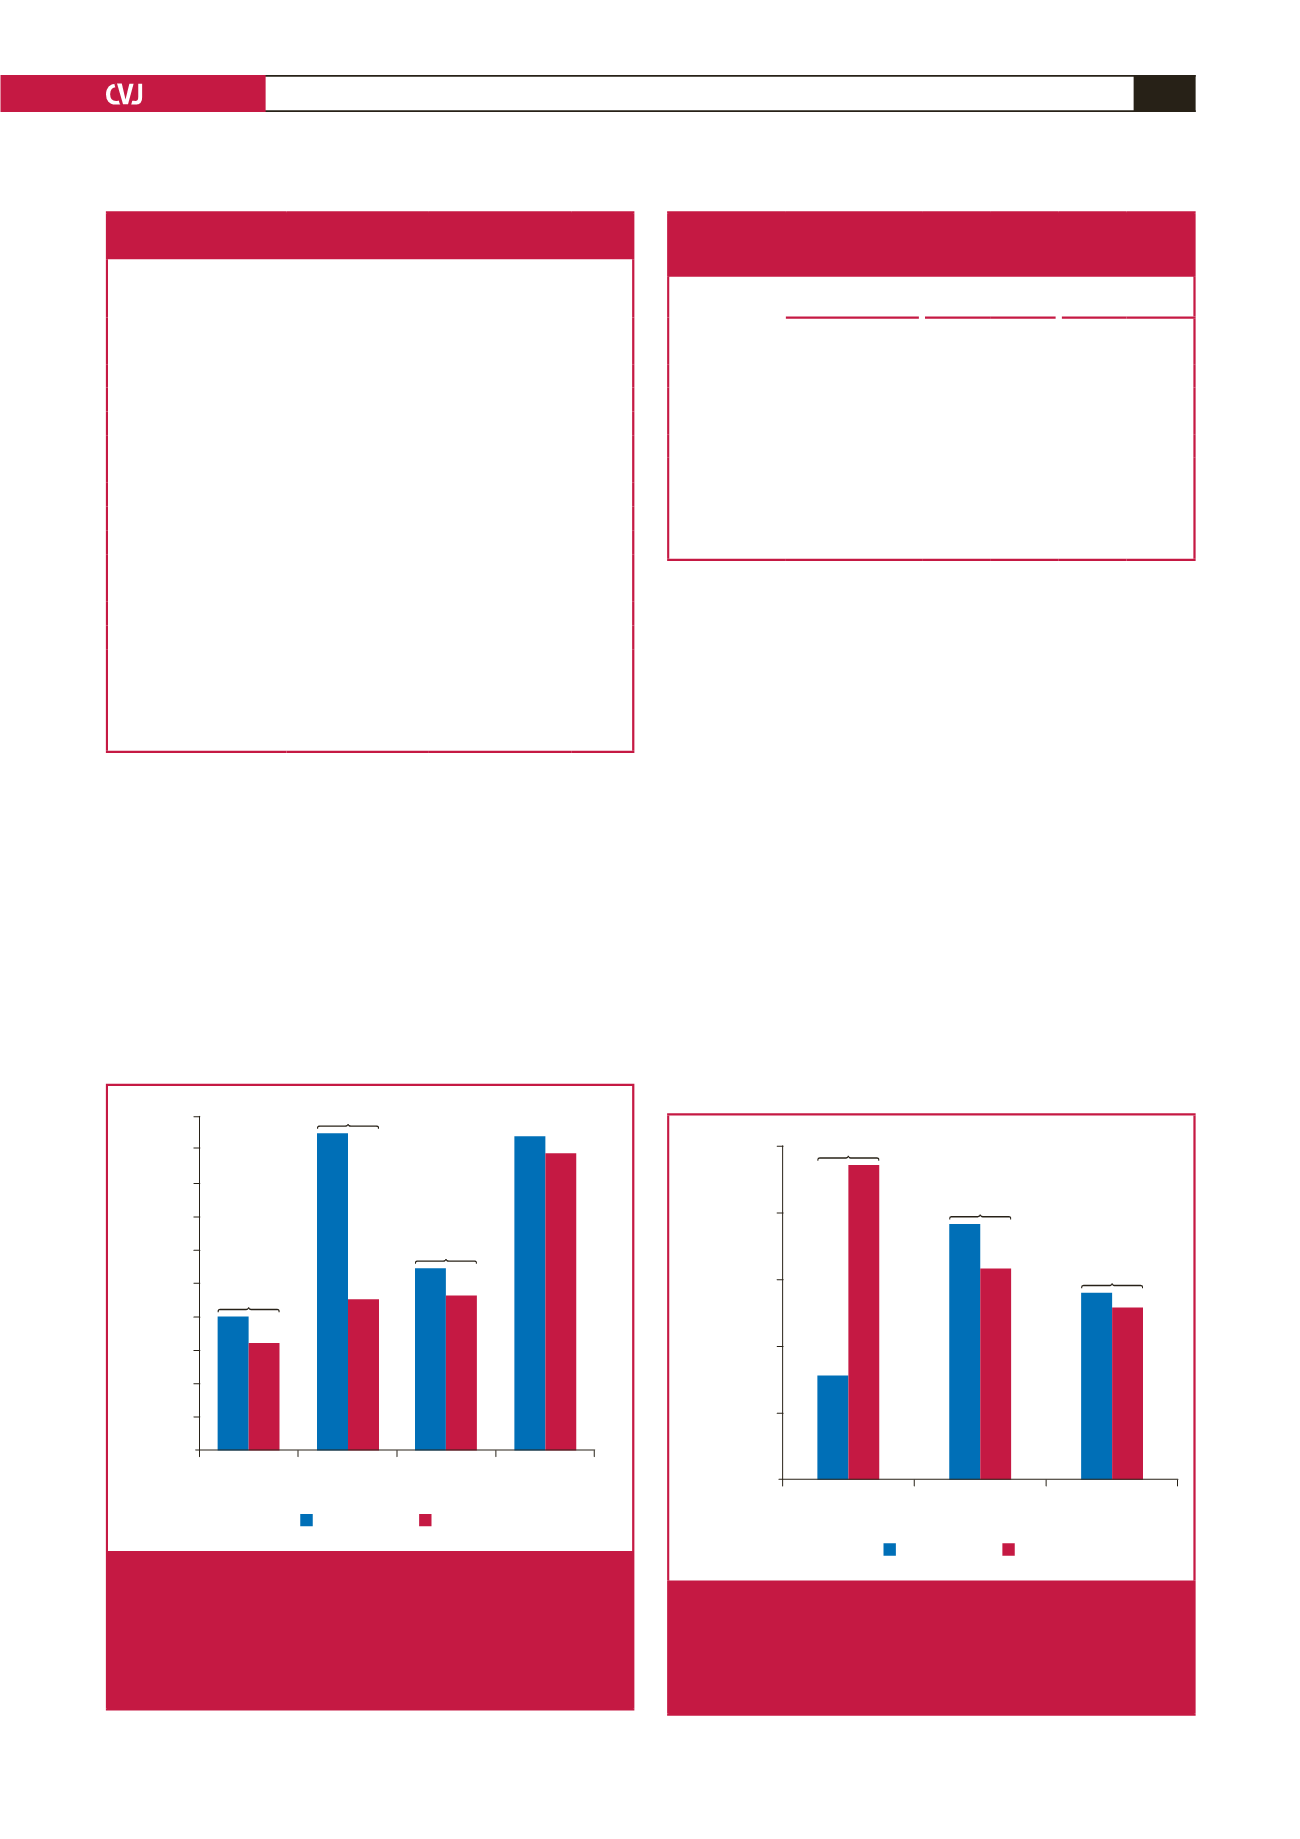
Circulating markers of ED
NO
ET-1
PAI-1
NO (
μ
mol/l)
ET-1 (pg/ml)
PAI-1 (pg/ml)
25
20
15
10
5
0
Diabetic
Non-diabetic
**
*
*
Fig. 2.
Comparison of mean serum levels of nitric oxide
(NO), endothelin-1 (ET-1) and plasminogen activa-
tor inhibitor (PAI-1) between the type 2 diabetes and
non-diabetic control groups. *Significant at
p
<
0.05;
**significant at
p
<
0.01.
Table 2. Correlations between age of the study subjects,
gender, different types of serum AGEs and selected
circulating markers of endothelial dysfunction
Parameters
Serum NO
(pmol/l)
Serum ET-1
(ng/ml)
Serum PAI-1
(ng/ml)
r
s
p-
value
r
s
p-
value
r
s
p-
value
Age
–0.236* 0.031 0.149 0.302 0.080 0.582
Gender
0.191 0.896 0.048 0.741 –0.230 0.109
TIAGEs (µg/ml) –0.382* 0.026 0.279* 0.012 –0.185 0.108
CML (ng/ml)
–0.412* 0.011 0.281* 0.021 –0.228 0.112
CEL (ng/ml)
–0.015 0.920 0.150 0.297 –0.145 0.758
FAGEs (Au)
0.050 0.722 –0.036 0.802 0.175 0.224
r
s
: Spearman rank correlation coefficient; TIAGEs: total immunogenic
advanced glycation end-products; CML: N
ε
-carboxymethyl-lysine; CEL:
N
ε
-carboxyethyl-lysine; FAGEs: fluorescent advanced glycation end-products;
Au: arbitrary units; *Correlation is significant at
p
<
0.05 level.