CARDIOVASCULAR JOURNAL OF AFRICA • Vol 21, No 2, March/April 2010
74
AFRICA
or two-way ANOVA followed by a Bonferroni correction or with
the Students
t
-test where applicable, using GraphPad Prism 5;
p
<
0.05 was considered as significant.
Results
AMPK activation
To determine whether the two pharmacological substances
AICAR and ZMP could exert physiological effects via activation
Western blotting
After boiling for five minutes, equal amounts of sample protein
from the various fractions were separated on a 10% SDS-PAGE
and transferred to Immobilon
TM
-P membranes. Transfer and
equal loading were confirmed using the reversible stain, Ponceau
red. Non-specific binding sites were blocked with 5% fat-free
milk powder in TRIS-buffered saline (TBS) for two hours at
room temperature and then incubated with either the phospho-
Akt (Ser
473
), GLUT4 (H-61):
sc-7938
or phospho-AMPK (Thr
172
)
primary antibody [1:1000 dilution in TBS plus 0.1% Tween-20
(TBST)] for 16 hours at 4°C. After washing with TBST, the
membranes were treated for one hour with 1:4000 dilution of
anti-rabbit Ig, horseradish peroxidase-linked whole antibody and
the bands were visualised with the ECL method.
Membrane fractionation for measurement of
GLUT4 translocation
In order to determine GLUT4 translocation, cardiomyocytes
were fractionated into a sarcolemmal membrane and a cytosolic
compartment, essentially as described by Takeuchi
et al
.
38
After
stimulation with the various compounds, the cardiocytes were
washed twice with ice-cold HEPES buffer without albumin and
then sonicated on ice in TES buffer containing (in mM): Tris-
HCl 20, pH 7.5, EDTA 2, EGTA 0.5, sucrose 330 PMSF 1 and
25
µ
g/ml leupeptin. The homogenate was centrifuged to remove
particulate debris (1000
×
g
at 4°C for 10 min).
The supernatant was further fractionated by ultracentrifuga-
tion for 90 min at 40 000
×
g
at 4°C (Beckman, Ti50). The
supernatant obtained was considered to represent the cytosolic
fraction. The pellet was suspended in the aforementioned buffer
minus sucrose but containing 1% (vol/vol) Triton X-100 plus 1%
SDS and rotated at 4°C for 30 min. Afterwards the suspension
was ultracentrifuged at 40 000
×
g
for one hour at 4°C (Beckman,
Ti50), and the supernatant used as the membrane fraction.
Protein concentration was determined using the method of
Bradford,
37
samples were diluted in Laemmli sample buffer, boiled
for 5 min and stored at –20°C. GLUT4 content and distribution
were determined by Western blotting and suitable antibodies.
Detection of GLUT4 exofacial loop
Approximately 100 000 cardiomyocytes per sample were used
and washed once with PBS. After that, the cells were stained
with 1
µ
g GLUT4 antibody coupled to Alexa Fluor 488 accord-
ing to the manufacturer’s instructions, and washed with PBS.
A fixing step with 1 ml PBS containing 1% paraformaldehyde
(PFA) for 15 min at room temperature followed. Samples were
centrifuged at 4
×
g
for 5 min. Flow cytometric analysis was
done with a FACSCalibur using Cellquest 3.3 software (Becton
Dickinson, San Jose, California, USA). A forward-scatter against
side-scatter plot was used to distinguish the cells from the debris,
as described previously.
39
The fluorescence signal of the labelled
antibody bound to GLUT4 was detected in the FL-1 channel using
logarithmic amplification. Positive cells were defined by a fixed
gate and expressed as a percentage of the total cell population.
Statistical analyses
Results are presented as mean
±
SEM. The significance of the
differences between groups was analysed with either a one-way
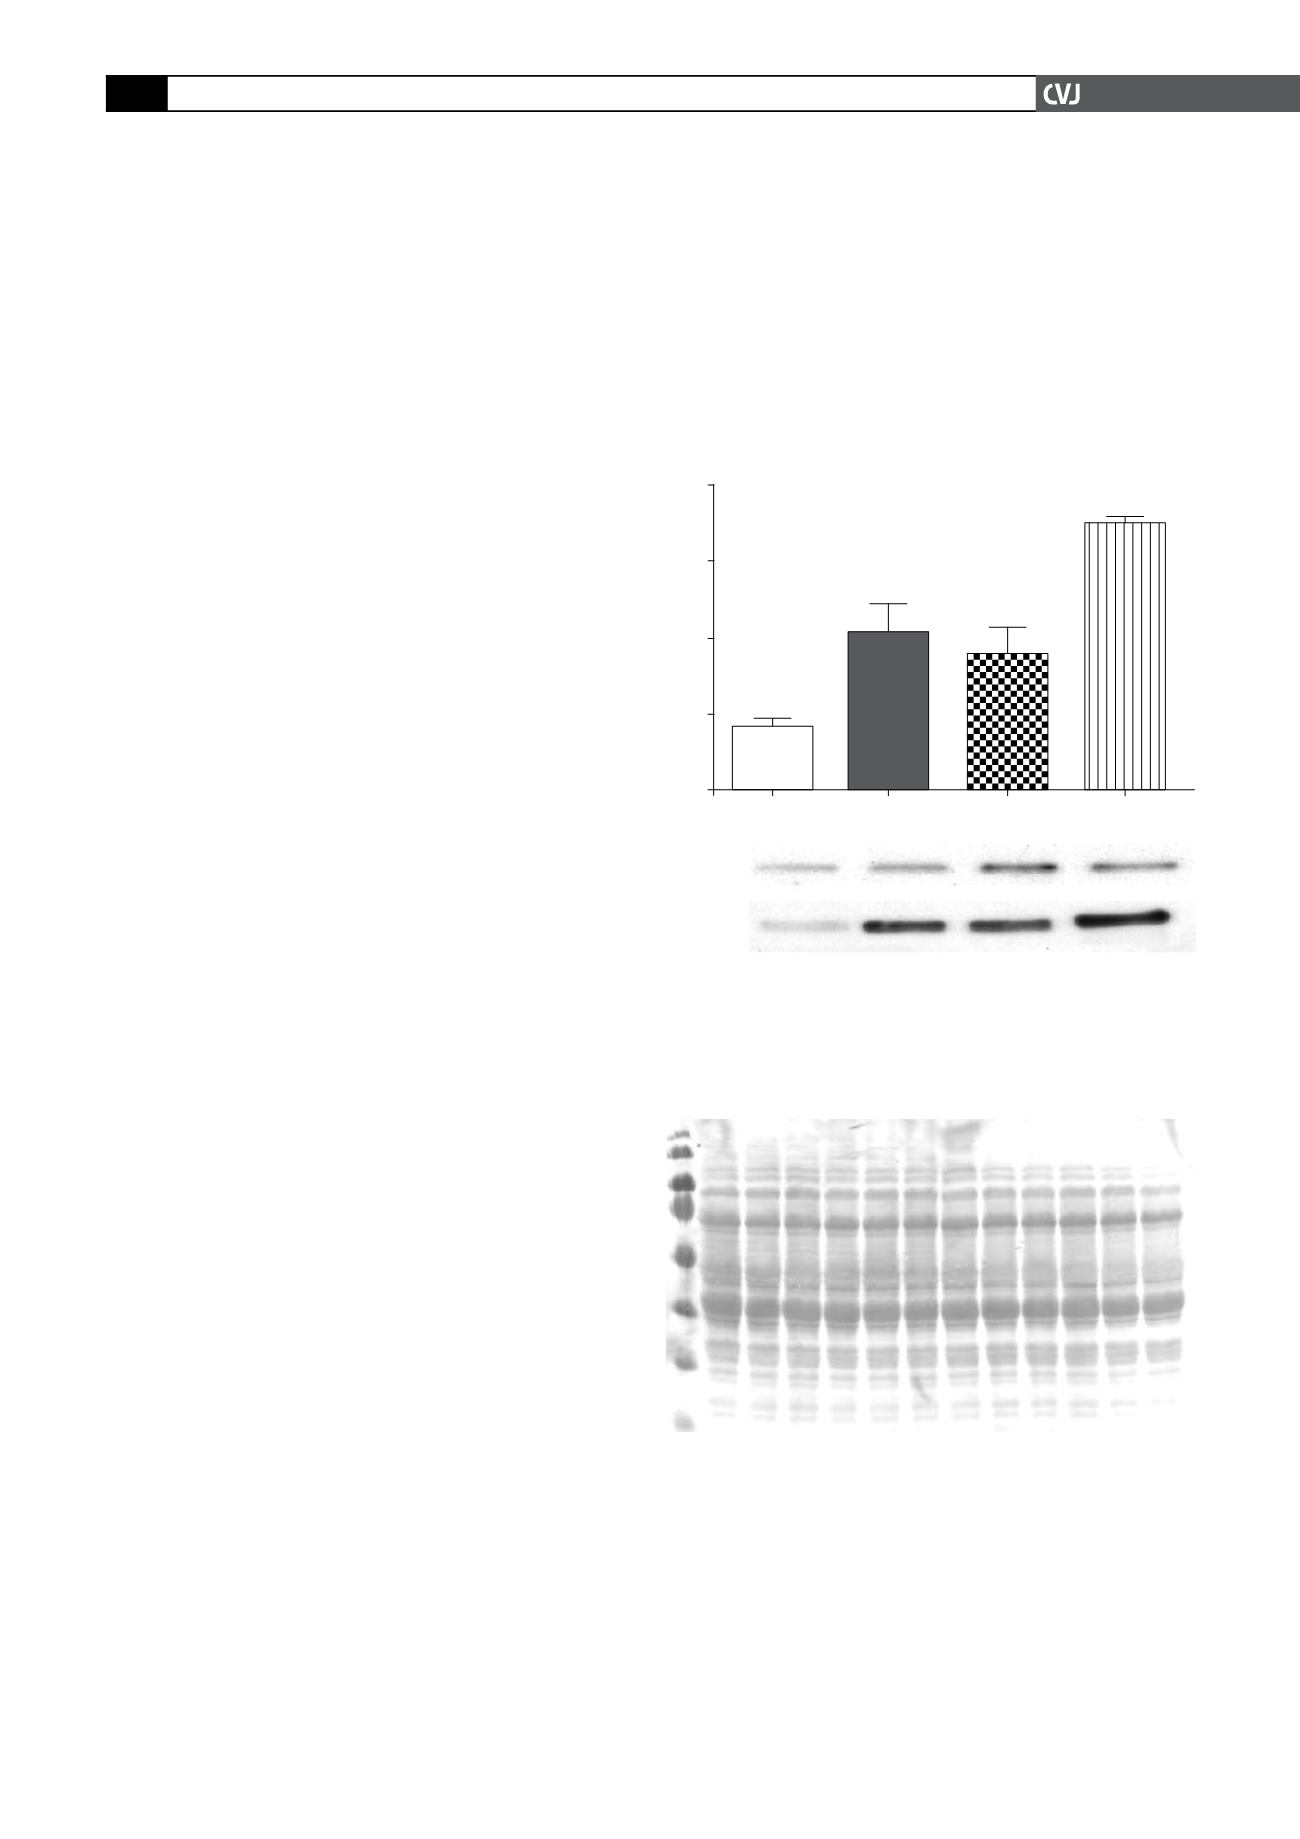
Fig. 1. A: Lysates of cardiomyocytes were prepared
after stimulation for 30 min with either AICAR (1 mM) or
ZMP (1 mM) as described in Methods; 50
µ
g of protein
were loaded per lane, separated and, after Western
blotting, probed with an antibody against the Thr
172
-
phosphorylated form of AMPK. Cells made anoxic by
bubbling nitrogen through the incubation medium were
used as a positive control. After visualisation, blots were
analysed with laser scanning densitometry. B: A repre-
sentative Western blot of phosphorylation of AMPK and
ACC as substrate of AMPK to demonstrate activation. C:
A Ponceau red-stained membrane to show equal loading
of proteins. All values are expressed as mean
±
SEM (
n
=
4); *
p
<
0.05 vs basal level; **
p
<
0.01 vs basal level.
Arbitrary Densitometry Units
4
3
2
1
0
Basal
AICAR
ZMP
Anoxia
**
*
**
pAMPK
pACC
Aicar
–
+
–
–
ZMP
–
–
+
–
Anoxia
–
–
–
+


