CARDIOVASCULAR JOURNAL OF AFRICA • Vol 21, No 6, November/December 2010
330
AFRICA
past medical history was normal and she was a non-smoker. Her
physical examination was normal. Surface electrocardiogram
showed 2-mm ST elevation in leads D
2
, D
3
and aVF with patho-
logical Q waves and negative T waves, suggesting a sub-acute
phase of inferior MI. Her biochemical markers of MI were
higher than the upper limits of normal.
She was admitted to the coronary care unit with a diagnosis
of sub-acute inferior MI and started on isosorbite mononitrate 60
mg/day (p.o.), metoprolol succinate 100 mg/day (p.o.), acetyl-
salicylic acid 300 mg/day (p.o.), clopidogrel 75 mg/day (p.o.)
and enoxaparine 1 mg/kg, bid, (s.c.). Transthoracic echocardi-
ography was performed in the first hour after admission to the
coronary care unit on day one and showed akinesia in the basal
septum and mid-basal inferior wall, with a calculated ejection
fraction of 45%.
The patient was transferred to a room after an uncomplicated
course of 36 hours. On the second day, at 08:00 her medical exam-
ination was normal. One hour later, after using the toilet and after
several attempts at Valsalva manoeuvres, she felt sudden chest
pain, dyspnoea and nausea. Her heart rate was 110/minute, blood
pressure was 80/60 mmHg, and a new systolic murmur was
recorded at the left sternal border with thrill and bilateral rales
at the basal level of both lungs. Her surface electrocardiogram
was unchanged. She was immediately transferred to the coronary
care unit. This was the fourth day after admission to hospital.
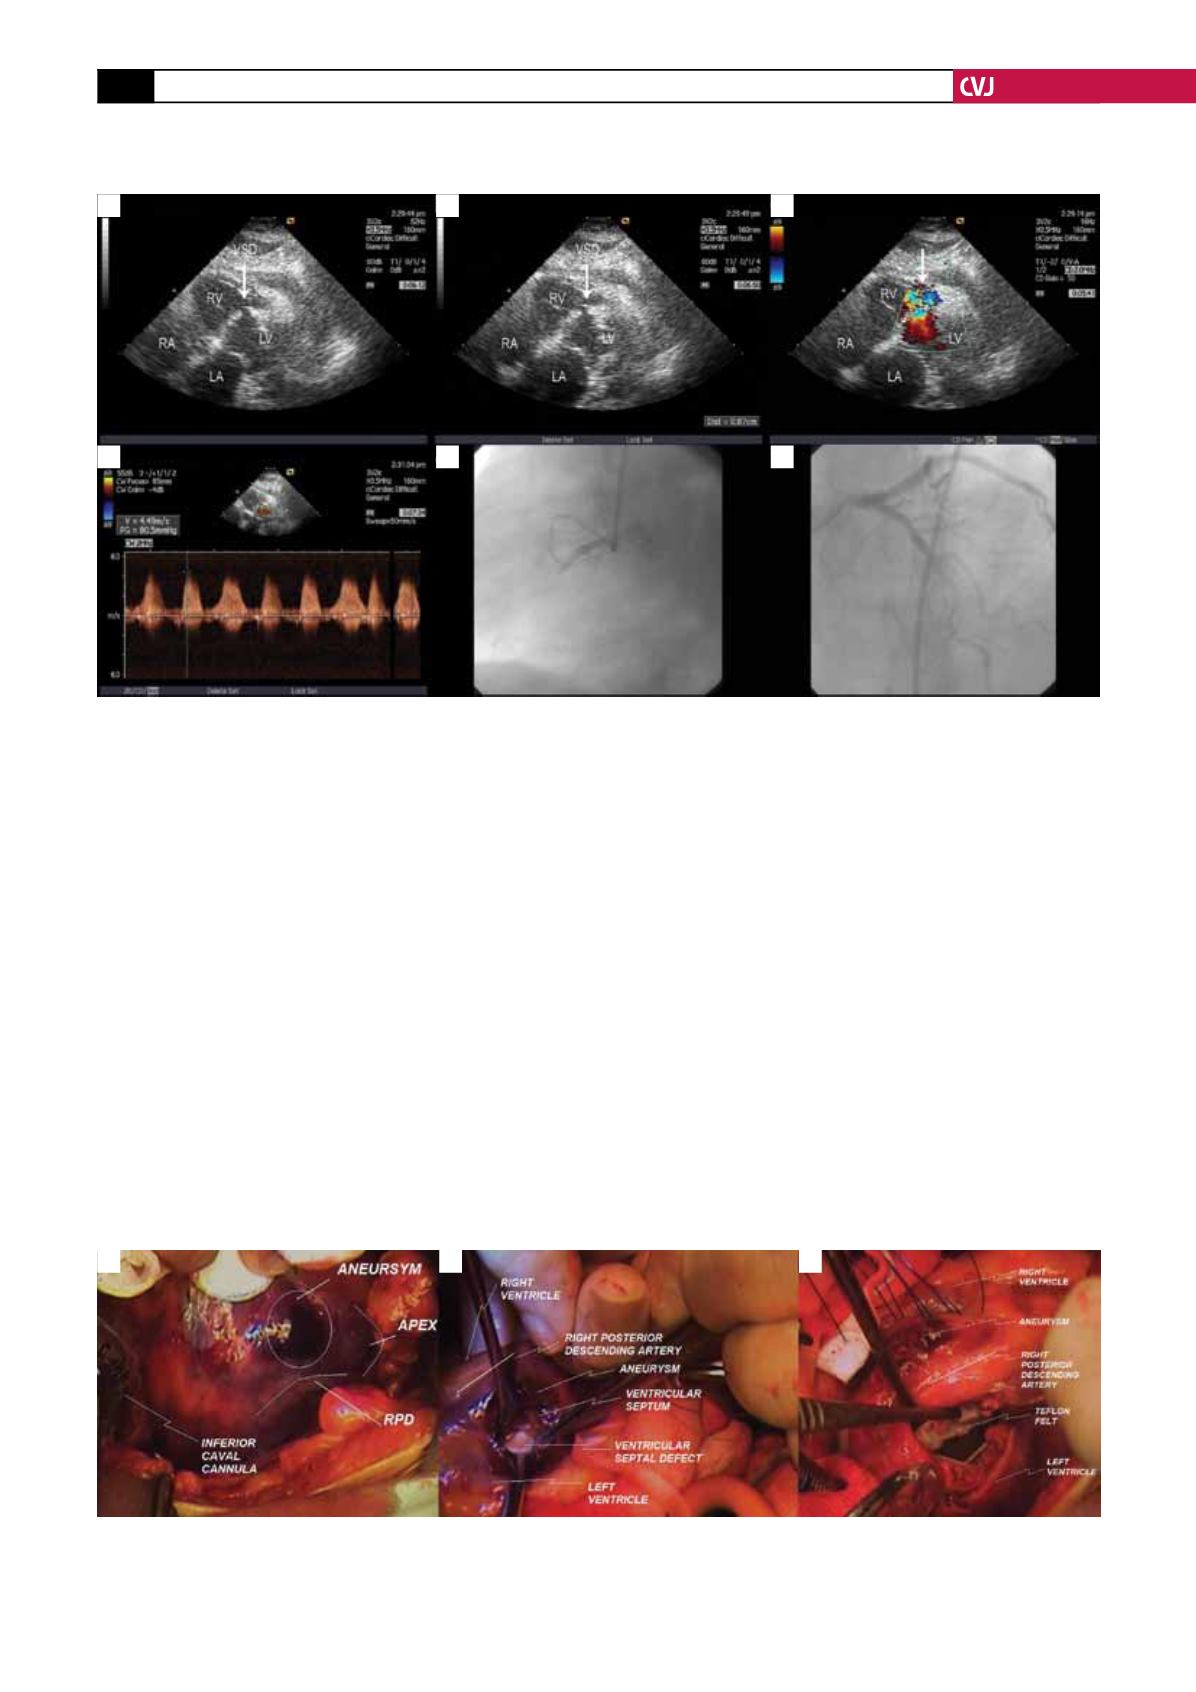
A second transthoracic echocardiography was performed and
revealed a left ventricular infero-basal aneurysm, infero-mid and
infero-septal akinesia and a ventricular septal defect in the basal
mid-interventricular septum, creating a peak 80-mmHg gradient
and mild pericardial effusion (Fig. 1a–d). Intravenous saline was
Fig. 2. A. Right ventricle inferior wall showing aneurysmal dilatation. B. Ventricular septal defect visualised by the
surgeon’s finger from the aneurysmotomy through the left ventriculotomy. C. Ventricular septal defect fixed by teflon
felt sutures from the left ventriculotomy to the aneurysmotomy (right ventricle wall).
A
B
C
Fig. 1. The echocardiography and coronary angiogram of the patient. A. In this sub-costal view, the ventricular septal
defect is clearly seen in the mid-portion of the interventricular septum (arrow). B. In the same view as A, the defect
was measured as 0.8 cm at the largest diameter (arrow). C. In the same view as A, colour Doppler reveals turbulent
flow from the left to the right ventricle (arrow). D. In the same view as A, on continuous wave Doppler there was a
peak 80-mmHg gradient across the defect. E. The coronary angiogram of the patient demonstrates a totally occluded
dominant right coronary artery (this view was taken from left anterior oblique 30° and cranial 0°). F. In this view, the
discrete 60% narrowing of the left anterior descending artery is seen (cranial 30°, left anterior oblique 0°). LV: left
ventricle; LA: left atrium; RV: right ventricle; RA: right atrium; VSD: ventricular septal defect.
A
B
C
D
E
F


