CARDIOVASCULAR JOURNAL OF AFRICA • Vol 23, No 10, November 2012
AFRICA
543
LQTc cohort also had significantly higher serum cholesterol
levels than the NQTc cohort (Fig. 5).
A family history of IHD was significantly less common
among those with LQTc (
p
=
0.045) (
Table 1). No association
between LQTc and diabetes mellitus, smoking or hypertension
could be detected. No association could be demonstrated
between TVCAD and NQTc or LQTc (
p
=
0.96).
Discussion
This study provides further evidence that, regardless of coronary
revascularisation, QT prolongation before coronary angiography
associated significantly with increased mortality at six months,
lower LVEF and higher LVEDP. With regard to IHD risk factors,
LQTc patients had higher serum cholesterol values and rarely a
family history of IHD.
Traditionally, QT prolongation was seldom regarded by
interventional cardiologists to be clinically useful, but it has
recently been shown that the risk for coronary stenosis increases
by 33 to 41% for every 20-ms QTc interval prolongation.
29
The
ST segment, on the other hand, which forms an integral part
of the QT interval, is considered a better marker of underlying
coronary artery disease. Interventional cardiologists rely heavily
on ST segment shifts during exercise and recovery to identify
those patients who need diagnostic coronary angiography. Little
attention is given to the QTc interval, especially if it has to be
measured or calculated manually.
Once coronary angiography has been performed, stents
have been inserted and dual anti-platelet therapy (DAT) and
beta-blockers have been prescribed, patients are often seen only
weeks later for follow up at the outpatient clinic, where they
are assessed by a junior colleague. The routine ECG is studied
for new Q waves and cardiac arrhythmias. The blood pressure
is checked, drug compliance with DAT is reiterated, and the
patient is given a six-month follow-up appointment. Our data
suggest that more than 10% of patients with QTc prolongation
prior to coronary angiography will not return for their six-month
appointment because they have died suddenly.
The association of LQT with a lower but normal LVEF is
interesting. While there is no internationally agreed threshold of a
‘
low’ LVEF, it has been characterised in a report of the American
Society of Echocardiography and the European Association
of Echocardiography by gradation: mild (45–54%), moderate
(30–44%)
and severe (
<
30%)
left ventricular dysfunction.
30
Only
one study reported an association between LQTc and impaired
LV function.
31
The authors also reported that the QTc interval
increased significantly from one- to three-vessel disease. We
did not find this correlation between TVCAD and LQTc in our
study.
The mechanism by which a decreased LVEF results in
QT prolongation is unknown, but may involve ion-channel
remodelling and/or intracellular calcium transport.
32
LVEF is
frequently used to prognosticate patients who have suffered a
myocardial infarction or who have dilated cardiomyopathy. It
is generally accepted that patients with an impaired systolic
function have a higher risk for sudden cardiac death, presumably
due to malignant ventricular tachydysrhythmias. In the Sudden
Cardiac Death in Heart Failure Trial (SCD-HeFT), implantable
cardioverter-defibrillator (ICD) therapy reduced all-cause
mortality by 23% compared with placebo.
33
Interestingly,
amiodarone, a commonly used anti-arrhythmic agent that also
prolongs the QT interval, was ineffective to prevent sudden death
in these patients.
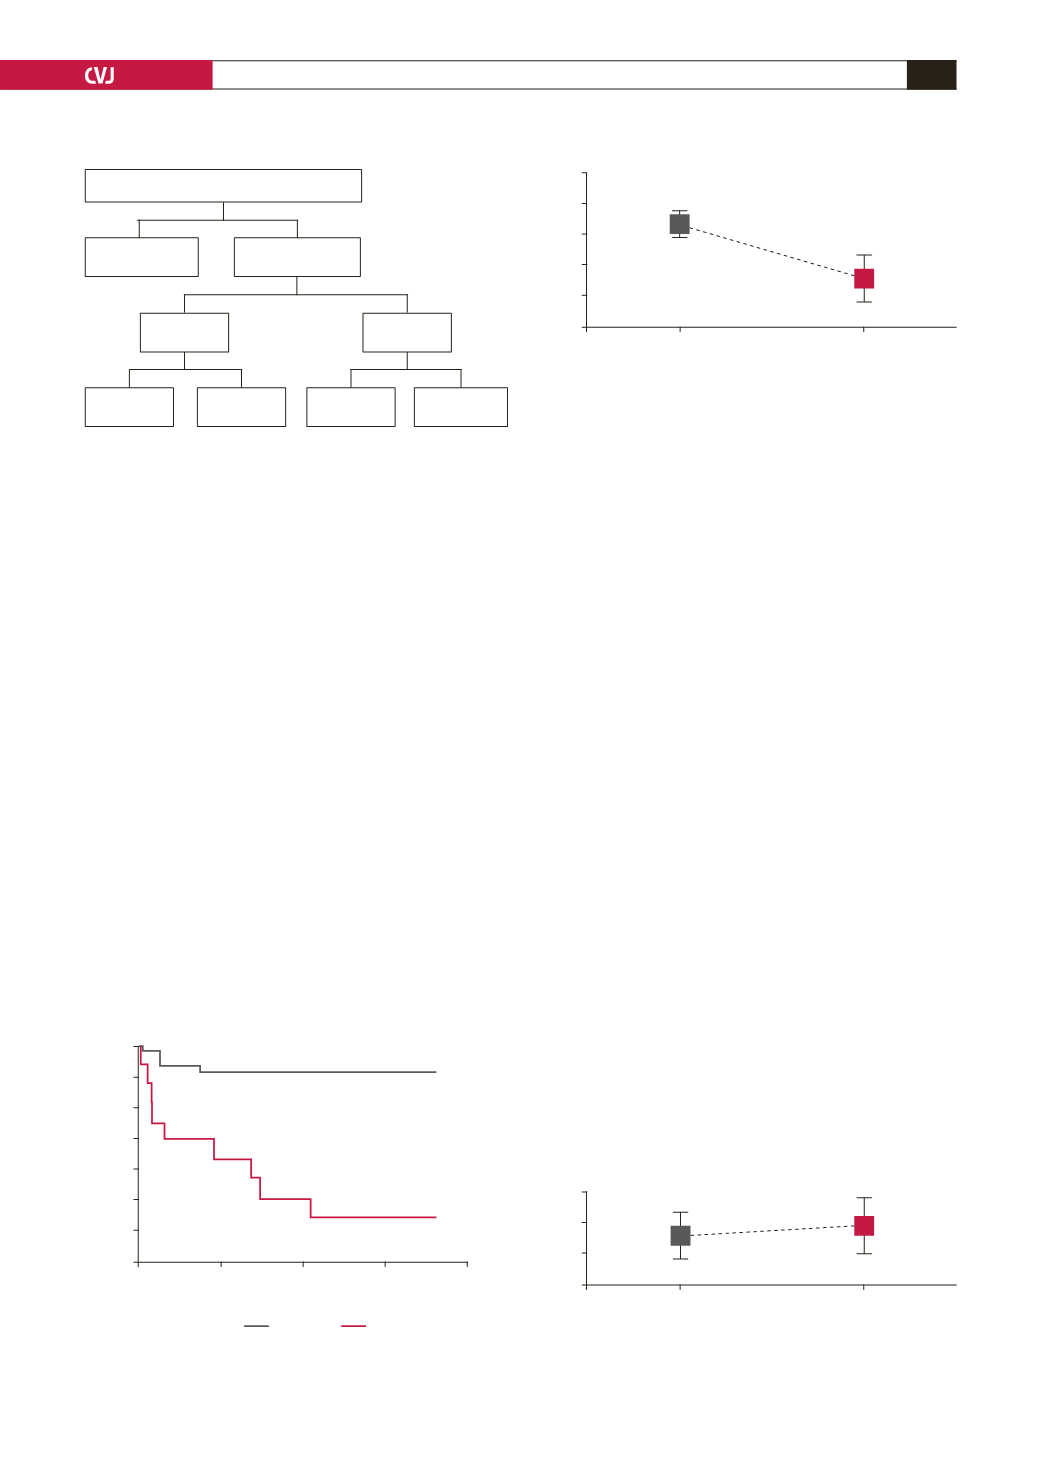
Fig. 1. Allocation of study subjects.
2 023
catheterised patients considered
1 702
patients
excluded
321
patients
enrolled
11
dead at
6
months
79
alive at
6
months
4
dead at
6
months
227
alive at
6
months
90
LQTc
231
NQTc
Fig. 2. Cumulative proportion of patients surviving versus
time elapsed (Kaplan–Meier).
1.00
0.98
0.96
0.94
0.92
0.90
0.88
0.86
0
50
100
150
200
Time elapsed (days)
Cumulative proportion surviving
p
<
0.01
NQTc
LQTc
Fig. 3. Mean LVEF versus QTc interval for NQTc and LQTc
groups of patients.
70
65
60
55
50
45
NQTc
LQTc
QTc interval
LVEF (%)
p
<
0.01
Bar = 95% CI
Fig. 4. Mean LVEDP (LVEF
>
45%)
versus QTc interval for
NQTc and LQTc groups of patients.
30
20
10
0
NQTc
LQTc
QTc interval
LVEDP (mmHg)
p
=
0.023
Bar = 95% CI


