CARDIOVASCULAR JOURNAL OF AFRICA • Vol 23, No 10, November 2012
AFRICA
549
comparisons was agreement excellent, as reflected by the
κ
statistic of 0.77. In three cases, the agreement was moderate
(0.40
< κ <
0.75).
In the remaining two cases, the agreement was
only marginal (
κ
=
0.29–0.32),
and these involved comparisons
of the random-effects rank and fixed-effects methods. The cross
tabulations in Table 3 are in close agreement with those obtained
when using only age, SBP and HR in the risk-adjustment model,
an indication that our results are insensitive to which factors are
included in the risk-adjustment model.
The results presented here are based on arbitrary choices.
In particular, the prior for the between-hospital variation is
critical as it dictates how much shrinkage is assumed in the
individual hospital estimates.
29
However, there is no standard
solution to the problem of choosing a prior on the random-
effects variance in hierarchical models. In standard Bayesian
analyses, the inverse-gamma prior family is preferred because
of its conditional conjugate properties, which allows ease of
mathematical derivations. But this prior has been shown to give
biased results.
30
On the other hand, the threshold values for RAMR have an
influence of the number of hospitals classified as outliers. We
performed a limited-sensitivity analysis to find out the extent to
which the choices impact on the results. We used a uniform (0,
100)
prior on the random-effects standard deviation
σ
o
and 15%
for the threshold value
δ
.
The uniform prior produced exactly
the same classifications of the hospitals as the inverse-gamma
prior on the random-effects variance. Using a threshold of 15%
affected only the 117 hospitals that were previously classified as
normal, and now two were classified as low outliers and five as
high outliers. Our results were therefore not affected by changes
in random-effects variances but slightly so when the threshold
value was changed.
TABLE 1. THE RISK-ADJUSTMENT MODEL OF 30-DAY
MORTALITY USING BASELINE RISK FACTORS, DISCHARGE
ECG FINDINGSAND BIOCHEMICAL MARKERS
Risk factor
Number of
patients
Number of
deaths (%)
Odds ratio
(95%
CI)
Age group (years)
<
55
14 116
233 (1.7)
1.00
55–64
16 396
549 (3.4)
2.02 (1.72–2.37)
65–74
21 442 1 703 (7.9)
5.06 (4.38–5.84)
75–84
23 006 3 656 (15.9) 10.73 (9.33–12.34)
≥
84
9 249 2 259 (24.4) 18.03 (15.61–20.83)
SBP (mmHg)
<
117
16 609 3 082 (18.6)
1.00
117–132
16 745 1 716 (10.3)
0.56 (0.52–0.60)
133–146
16 458 1 354 (8.2)
0.43 (0.40–0.46)
147–164
17 072 1 161 (6.8)
0.33 (0.31–0.36)
≥
165
17 325 1 087 (6.3)
0.27 (0.25–0.29)
Heart rate (beats/min)
<
62
18 135
1213 (6.7)
1.00
62–72
15 538
991 (6.4)
1.10 (0.99–1.20)
73–83
16 836 1 373 (8.2)
1.38 (0.27–1.51)
84–98
16 600 1 905 (11.5)
1.84 (1.70–2.00)
≥
99
17 100 2 918 (17.1)
2.55 (2.36–2.75)
Discharge diagnosis
ST elevation
29 389 3 612 (12.3) 8.59 (6.09–12.11)
Non-ST elevation
29 462 3 379 (11.5)
5.29 (3.75–7.47)
Tropin positive
6 719
368 (5.5)
2.59 (1.81–3.71)
Tropin negative
6 326
58 (0.9)
0.67 (0.43–1.02)
Chest pain
3 136
34 (1.1)
1.00
Other
Total
84 209 8 400 (9.98)
4.68 (3.29–6.67)
TABLE 2. OBSERVED, EXPECTEDAND RISK-ADJUSTED
30-
DAY MORTALITY RATEAFTERACSADMISSION,
2003–2005,
ENGLANDANDWALES
Hospital
Number of
admissions*
Observed
deaths
Expected
deaths
RAMR (95% CI)
Top five
1
737
39
89.65 4.54 (3.32–6.21)
2
167
5
10.58 4.82 (2.01–11.58)
3
232
9
18.99 4.83 (2.52–9.29)
4
209
10
20.10 5.07 (2.73–9.43)
5
2 158
71
123.56 5.86 (4.64–7.40)
Bottom five
124
289
42
27.43 15.62 (11.54–21.13)
125
24
5
3.21 15.90 (6.62–38.19)
126
21
4
2.50 16.31 (6.12–43.44)
127
348
63
37.45 17.16 (13.40–21.96)
128
97
19
9.97 19.44 (12.40–30.48)
*
With a valid 30-day status.
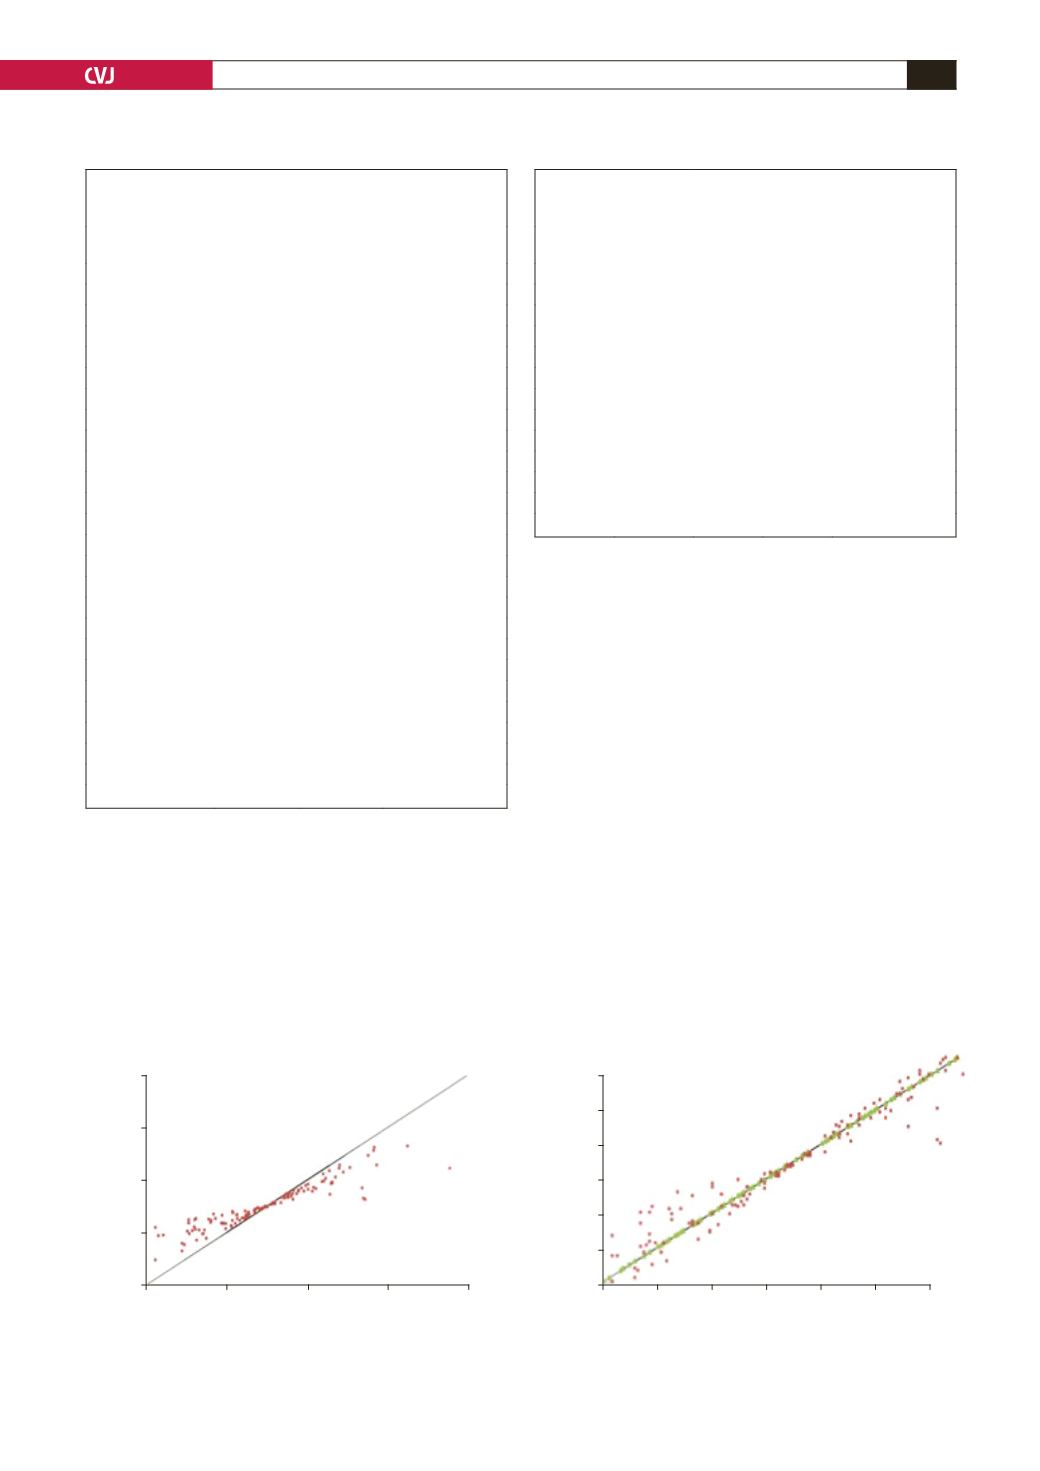
Fig. 1. Scatter plots of agreements in hospital’s risk-adjusted mortality rate (A) and rank of the risk-adjusted mortality
rate (B) between the fixed- and random-effects models. For each plot, the line of equality is shown.
20
16
12
8
4
115
96
77
58
39
20
1
4
8
12
16
20
1
20
39
58
77
96
115
Risk-adjusted mortality rate using fixed-effects model
Risk-adjusted mortality rate using fixed-effects model
Risk-adjusted mortality rate using
random-effects model
Risk-adjusted mortality rate using
random-effects model
A
B


