


 26 / 74

CARDIOVASCULAR JOURNAL OF AFRICA • Volume 25, No 5, September/October 2014
220
AFRICA
NYHA class and presence of tricuspid and mitral regurgitation.
In a multiple regression analysis for predictors of mortality at
180 days, none of these variables reached statistical significance.
Discussion
This is the first detailed study of the clinical profile and short-
or medium-term outcome of AHF cases in southern Nigeria.
Similar to our earlier observation,
24
AHF in our community
predominantly affects younger and middle-aged individuals who
are in the prime of their lives. Hypertensive heart disease and
other non-ischaemic aetiology contribute to over 90% of the
cases.
The majority of our subjects presented with
de novo
acute
HF. Our findings with the use of some disease-modifying
agents such as angiotensin converting enzyme (ACE) inhibitors
or angiotensin II receptor blockers (ARBs), aldosterone
antagonists (except for beta-blockers and hydralazine–isosorbide
combination) are remarkably similar to findings in many other
parts of the world.
6,8
Mortality rates in the short and medium
term are relatively low, and higher in women than men.
Our findings of relatively young age at presentation for AHF
is similar to reports from many parts of Africa.
1,4,25
AHF patients
on the continent are about 20 years younger than similar patients
in high-income countries.
6-9
This implies that HF afflicts our
population in their productive years, with attendant economic
loss to the society and greater disability-adjusted life years.
The comparable or even lower short- or medium-term
mortality rate of HF in our cohort compared to findings in high-
income countries is an important observation from this study.
7,8
Mortality rates in our study were 4.2% (95% CI: 2.4–7.3%) and
7.3% (95% CI: 14.7–11.2%) at 30 days and 180 days, respectively.
Unlike findings in high-income countries,
26,27
we noted that
age was not associated with poorer outcome in our cohorts.
Our finding of a better prognosis in obese individuals is similar
to that of other researchers.
27,28
In the Framingham study, high
BMI was associated with a better prognosis (HR for mortality
per one SD: 0.88, 95% CI: 0.75–1.04 for men, and 0.86, 95%
CI: 0.72–1.03 for women). This may also be consistent with the
‘obesity paradox’ in HF.
29-31
Underweight in HF patients may be
indicative of cardiac cachexia, and progression of HF and poor
prognosis.
Lower blood pressure or pulse pressure was associated with
a poorer outcome. This may reflect advanced HF and decreased
stroke volume. This has been noted in previous studies.
26,32
It is now well known that impaired renal function is an
important predictor of all-cause mortality inHF.
33-35
This is similar
1.00
0.98
0.96
0.94
0.92
0.90
0
30 60 90 120 150 180
Duration (days)
Male
Female
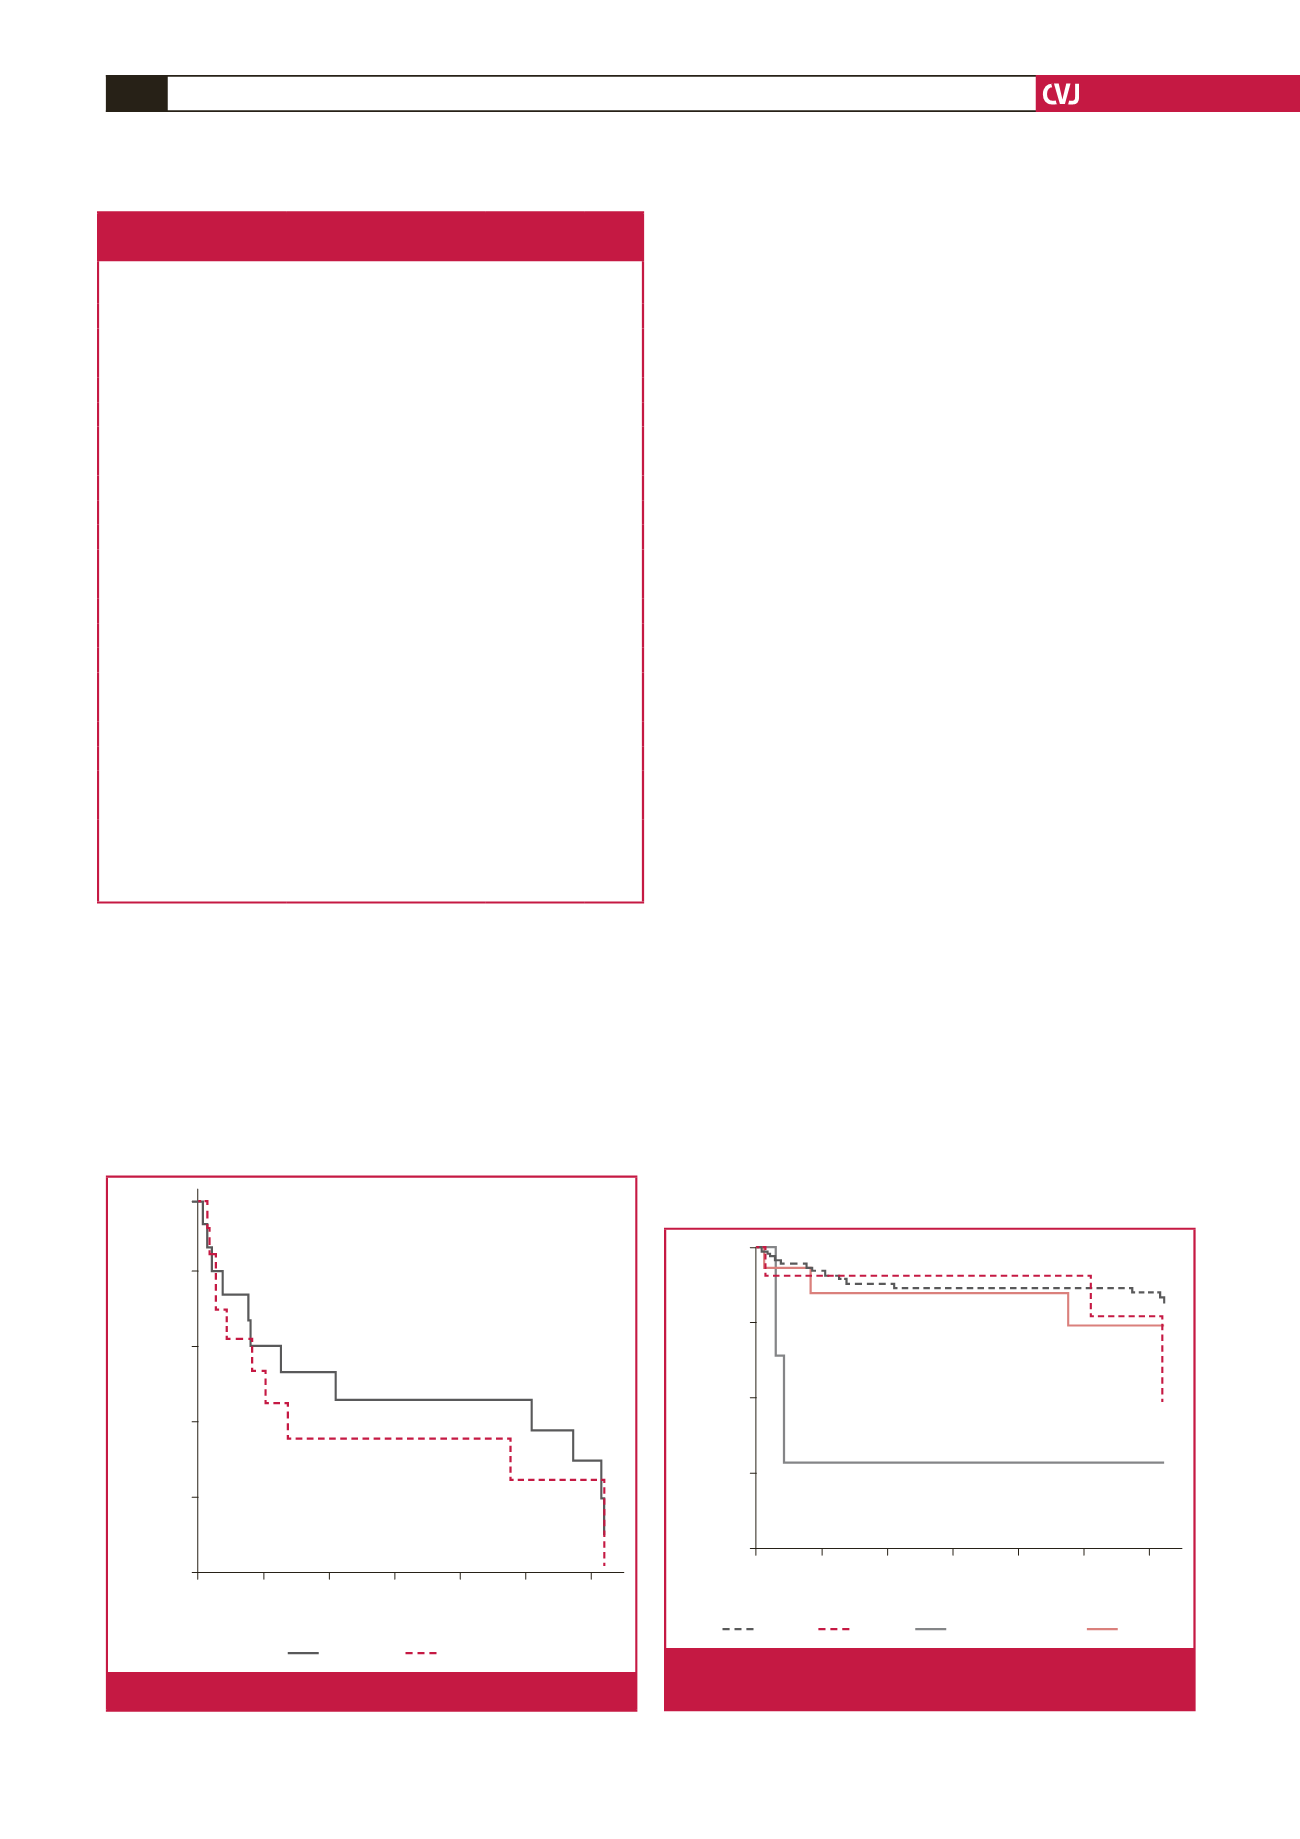
Fig. 2.
Kaplan–Meier survival curve for males and females.
1.00
0.90
0.80
0.70
0.60
0
30 60 90 120 150 180
Time (days)
Cumulative survival
HHF
Pericardial dx
DCM
Others
Fig. 3.
Kaplan–Meier survival curve for the different aetiologi-
cal risk factors.
Table 3.Twelve-lead ECG and echocardiographic
profile according to gender.
Variable
All
(
n
=
285)
Men
(
n
=
150)
Women
(
n
=
135) p-value
Ventricular rate (bpm)
96.3
±
22.5 94.3
±
17.3 101.3
±
21.8 0.110
QRS duration (ms)
116.0
±
26.2 117.1
±
24.5 107.8
±
41.1 0.213
QT interval (ms)
350.7
±
30.6 374.3
±
35.0 348.8
±
45.5 0.006
Corrected QT (ms)
442.0
±
20.9 462.2
±
38.2 447.6
±
36.2 0.085
Atrial fibrillation (%)
13.3
16.7
9.6
0.337
Aortic root diameter (cm) 3.2
±
0.6 3.26
±
0.58 2.84
±
0.38
<
0.001
Left atrial diameter (cm)
5.9
±
0.8 4.75
±
0.89 4.50
±
0.85 0.176
Left atrial area (cm
2
)
30.15
±
9.91 28.8
±
9.0 24.7
±
6.3 0.010
IVSD (cm)
1.18
±
0.28 1.33
±
0.39 1.23
±
0.32 0.393
LVPWd (cm)
1.38
±
0.35 1.19
±
0.39 1.10
±
0.35 0.116
LVIDd (cm)
5.52
±
0.97 5.81
±
1.61 5.16
±
1.45 0.353
LVIDs (cm)
4.51
±
1.57 4.80
±
1.63 4.16
±
1.43 0.001
Fractional shortening (%) 14.5
±
2.97 17.77
±
13.10 19.80
±
12.21 0.060
Ejection fraction (%)
36.8
±
6.53 40.57
±
23.61 45.12
±
20.11 0.007
E/A ratio
2.11
±
1.55 2.14
±
1.47 1.90
±
1.25 0.199
DT (ms)
145.8
±
59.2 144.2
±
58.3 147.9
±
60.5 0.480
IVRT (ms)
111.0
±
34.3 114.9
±
35.8 106.1
±
32.1 0.127
LV mass (absolute)
449.0
±
217.5 561.7
±
106.6 233.0
±
54.24 0.026
LV mass (indexed)
274.1
±
117.5 336.4
±
46.6 160.9
±
16.1 0.016
Mitral regurgitation (%)
19.6
18.7
20.7
0.894
Tricuspid regurgitation (%)
15.1
12.7
17.8
0.459
IVSD
=
interventricular septal wall thickness in diastole, LVPWd
=
left
ventricular posterior wall thickness in diastole, LVIDd
=
left ventricular inter-
nal diameter in diastole, LVIDs
=
left ventricular internal diameter in systole,
DT
=
deceleration time, IVRT
=
isovolumic relaxation time.