


 41 / 74

CARDIOVASCULAR JOURNAL OF AFRICA • Volume 25, No 5, September/October 2014
AFRICA
235
Table 1. Clinical profile of the subjects
Parameters
All
(
n
=
77)
Male
(
n
=
54)
Female
(
n
=
23)
p
-value
Age, years
53.8
±
13.2 53.8
±
15.8 51.7
±
13.6 0.56
Smoking habits,
n
(%)
24 (13.1)
22 (18.6)
2 (2.5)
<
0.001
Body mass index,
kg/m
2
24.30
±
7.0 24.2
±
7.6 24.5
±
5.9 0.86
Palpitations,
n
(%)
40 (51.9)
24 (44.4)
16 (69.6)
0.002
Peripheral oedema,
n
(%)
49 (63.2)
35 (64.8)
14 (60.8)
NS
NYHA class
II,
n
(%)
14 (18.2)
10 (18.5)
4 (17.5)
III,
n
(%)
49 (63.6)
35 (64.8)
14 (60.8)
IV,
n
(%)
14 (18.2)
9 (16.7)
5 (21.7)
SBP, mmHg
149.1
±
23.8 149.9
±
23.8 147.7
±
23.9 0.55
DBP, mmHg
98.1
±
13.9 98.2
±
13.9 97.9
±
13.9 0.92
PP, mmHg
55.8
±
16.2 56.4
±
16.8 54.7
±
15.0 0.52
MAP, mmHg
101.3
±
16.4 101.2
±
17.2 101.5
±
15.0 0.89
FBS, mmol/l
5.3
±
2.2 5.2
±
2.0 5.4
±
2.4 0.58
Total cholesterol,
mmol/l
4.2
±
1.2 4.1
± 0
.2 4.3
±
1.2 0.22
LDL cholesterol,
mmol/l
2.7
±
0.9 2.6
±
1.0 2.8
±
1.0 0.14
HDL cholesterol,
mmol/l
1.1
±
0.4 1.1
±
0.4 1.1
±
0.3 0.63
Estimated GFR,
ml/min/1.73 m
2
101.5
±
38.8 111.6
±
41.4 78.3
±
17.0
<
0.0001
NT-proBNP, pg/ml 501.7
±
199.8 513.0
±
208.5 478.7
±
184.7 0.58
Serum ST2, ng/ml 112.9
±
78.7 100.1
±
60.4 134.4
±
98.3 0.26
SBP
=
systolic blood pressure, DBP
=
diastolic blood pressure, PP
=
pulse pressure, MAP
=
mean arterial pressure, FBS
=
fasting blood
sugar, LDL
=
low-density lipoprotein, HDL
=
high-density lipoprotein,
GFR
=
glomerular filtration rate.
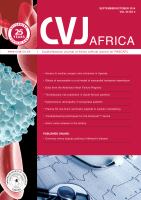
Fig. 1.
Top: apical four-chamber view of one of the subjects
with the M-mode cursor at the tricuspid annulus.
Bottom: M-mode image of the tricuspid annulus from
where TAPSE is measured.
Table 2. Echocardiographic profile of the subjects
Parameters
All
(
n
=
77)
Male
(
n
=
54)
Female
(
n
=
22)
p
-value
RVD, cm
3.4
±
0.6 3.5
±
0.6 3.2
±
0.5 0.22
Left atrial diameter, cm 4.6
±
0.9 4.6
±
0.9 4.5
±
0.8 0.17
IVSDd, cm
1.1
±
0.3 1.1
±
0.2 1.0
±
0.3 0.03
PWDd, cm
1.1
±
0.2 1.2
±
0.2 1.1
±
0.2 0.07
EDD, cm
5.8
±
1.1 5.9
±
1.1 5.5
±
1.1 0.04
ESD, cm
4.7
±
1.3 4.9
±
1.2 4.5
±
1.3 0.07
LAA, cm
2
24.5
±
7.0 24.5
±
6.7 24.4
±
7.5 0.95
RAA, cm
2
22.3
±
8.1 22.6
±
8.0 21.7
±
8.5 0.50
LVM/height
2.7
108.3
±
46.3 117.5
±
35.4 112.5
±
42.3 0.65
LVEF, %
35.2
±
17.5 34.4
±
16.8 36.6
±
18.7 0.58
ME, m/s
0.78
±
0.3 0.76
±
0.30 0.81
±
0.30 0.43
MA, m/s
0.49
±
0.2 0.49
±
0.2 0.49
±
0.1 0.25
ME/MA
2.2
±
1.3 2.0
±
1.2 2.2
±
1.4 0.96
DT, ms
143.2
±
80.6 143.7
±
85.1 142.2
±
72.2 0.22
TAPSE, mm
16.2
±
5.1 16.6
±
5.4 15.5
±
4.5 0.16
TAPSE
<
15 mm (%)
33 (42.9)
54 (40.7)
10 (41.7)
0.18
RVSP, mmHg
31.4
±
10.5 31.4
±
10.4 31.3
±
10.5 0.97
RVD
=
right ventricular diameter in diastole, IVSDd
=
interventricular
septal diameter in diastole, PWDd
=
posterior wall diameter in diastole,
EDD
=
end-diastolic diameter, ESD
=
end-systolic diameter, LAA
=
left
atrial area, RAA
=
right atrial area, LVM
=
left ventricular mass, LVEF
=
left ventricular ejection fraction, ME
=
early mitral inflow, MA
=
late
mitral inflow, DT
=
deceleration time, TAPSE
=
tricuspid annular plane
systolic excursion, RVSP
=
right ventricular systolic pressure.
Table 3. Clinical and echocardiographic
correlates of NT-pro BNP
Parameters
Coefficient of association (
r
)
p
-value
Age (years)
0.17
0.04*
BMI
–0.07
0.40
Pulse pressure
0.26
0.002*
Mean arterial pressure
0.26
0.002*
IVSDd
0.17
0.05
PWDd
0.08
0.36
LVIDd
0.16
0.05
LVIDs
0.21
0.01*
RVD
0.09
0.31
LAA
0.02
0.80
RAA
0.20
0.04*
LVM/height
2.7
0.09
0.30
LVEF
–0.21
0.01*
ME
0.02
0.79
MA
0.12
0.15
Mitral E/A ratio
0.08
0.35
Deceleration time
0.14
0.09
TAPSE
–0.23
0.15
IVSDd
=
interventricular septal diameter in diastole, PWDd
=
poste-
rior wall diameter in diastole, LVIDd
=
left ventricular internal diam-
eter in diastole, LVIDs
=
left ventricular internal diameter in systole,
RVD
=
right ventricular diameter in diastole, LAA
=
left atrial area,
RAA
=
right atrial area, LVM
=
left ventricular mass, EF
=
ejection
fraction, ME
=
early mitral inflow, MA
=
atrial or late mitral inflow,
TAPSE
=
tricuspid annular plane systolic excursion.
*Significant at
p
<
0.05.
Table 4. Univariate analysis with right ventricular systolic
pressure and cardiac biomarkers
Parameters
Pearson correlation
p
-value
Serum ST2
0.75
<
0.0001
NT-proBNP
0.54
<
0.0001