


 54 / 70

CARDIOVASCULAR JOURNAL OF AFRICA • Volume 27, No 5, September/October 2016
324
AFRICA
Results
There were 785 (65%) females, mainly petty traders (41.4%) and
farmers (28.1%). The mean age of participants was 55.12
±
19.85
years (Table 1), with participants aged
≥
60 years constituting
51.4%. Six hundred and twenty-three (51.6%) subjects had no
formal education and only 8.3% had tertiary education. Eighty-
four per cent earned less than N20 000 ($120 US) per month. We
analysed the data of 1 083 participants.
Two hundred and sixty-six (22%) subjects consumed alcohol,
mainly beer (43.3%) and fresh palm wine (35.1%). Ninety-eight
per cent added salt to their meals while cooking but only 12.2%
added salt on the table while eating, and 43.5% were involved
in vigorous activity that increased heart rate and breathing.
Twenty-four (2%) participants had been told they had diabetes
and 18 (75%) were receiving treatment from medical doctors,
while seven (29%) used herbal remedies. There were 286 (23.6%)
participants with a prior history of hypertension before the
screening exercise.
Thirty-two (2.6%) participants were current cigarette smokers,
69 (5.7%) had elevated total cholesterol levels, 244 (20.2%)
elevated triglyceride levels, and 69 (5.7%) were obese; 65.1% had
low HDL-C values, while 3.7% (45) had high LDL-C levels and
11.1% high-risk atherogenic plasma index. Diabetes and elevated
uric acid levels were present in 63 (5.2%) and 422 (34.9%)
participants, respectively.
Systolic blood pressure (SBP)
≥
140 mmHg and diastolic
blood pressure (DBP)
≥
90 mmHg were seen in 499 (41.3%)
and 294 (22.4%), respectively. Two hundred and fifty (20.7%)
participants had high systolic and diastolic blood pressures.
Overall prevalence of hypertension was 542 (44.9%) subjects, of
whom 383 (70.6%) were over 60 years of age.
Participants with two or more risk factors were older than
those with none (
p
=
0.001) (Table 2), and similarly, the higher
the mean values of waist circumference, the more the clustering
of risk factors. There was a mean difference in SBP (14.6
±
2.8
mmHg,
p
<
0.01) and DBP (6.3
±
1.4 mmHg,
p
<
0.01), waist
circumference (5.9
±
1.2 cm,
p
<
0.01) and BMI (4.4
±
2.2 kg/m
2
,
p
=
0.36) between participants with two risk factors and those
with no risk factors (
p
<
0.01). However, a mean difference in
BMI of 3.4
±
0.5 kg/m
2
was significant between subjects with
three or more risk factors and those without any risk factors. At
a mean difference of 0.34
±
0.01 mmol/l, those with two or more
risk factors had higher total cholesterol than those without risk
factors (
p
=
0.006).
Classification by body adiposity showed that participants
with overweight (BMI
>
25 kg/m
2
) and obesity (BMI
>
30 kg/m
2
)
had higher clusters (two or more) of cardiovascular risk factors
than those with normal weight (34.5 vs 49.3 vs 42%,
p
=
0.01).
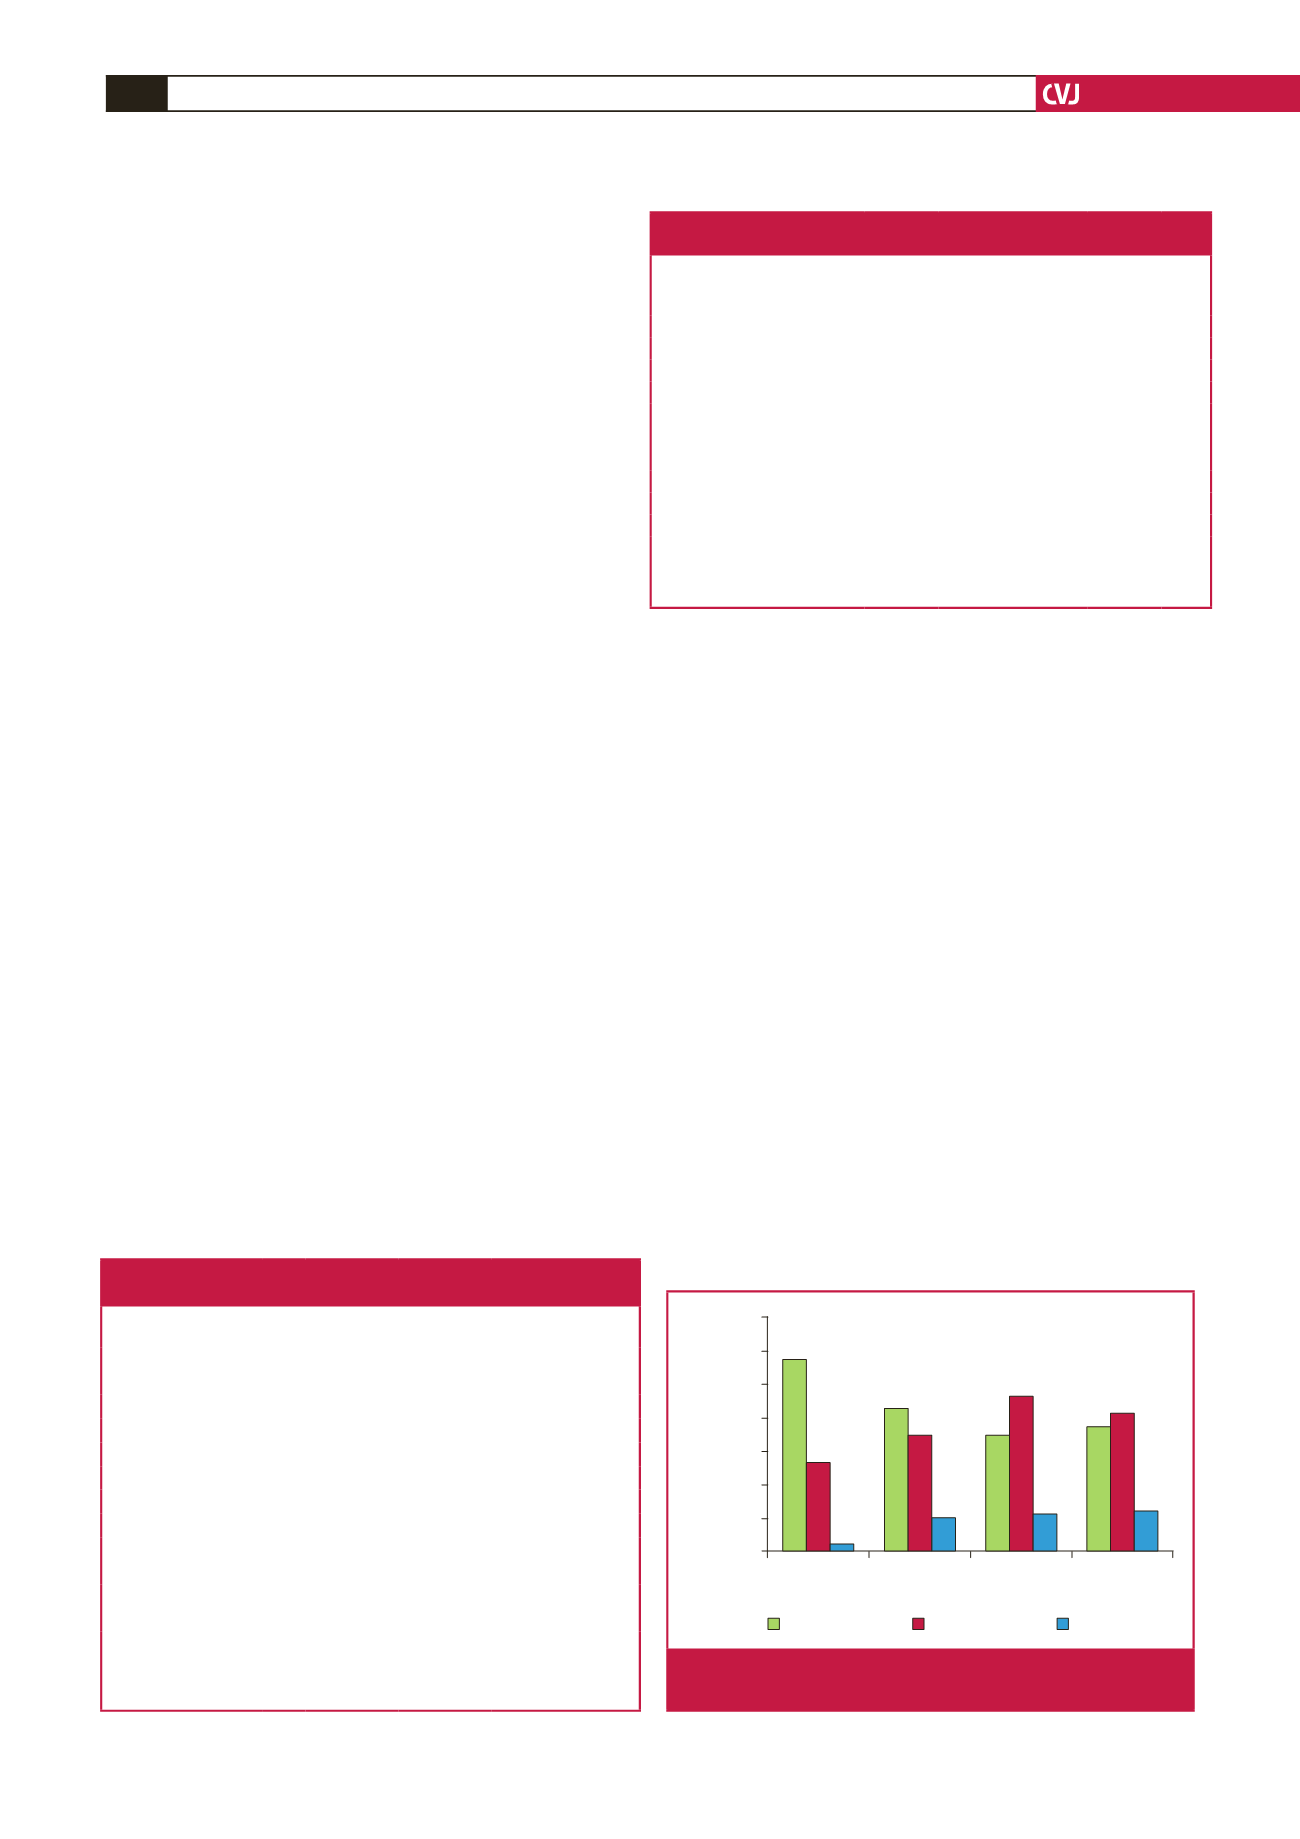
The prevalence of one, two and three or more cardiovascular
risk factors were 35.7, 32 and 7.7%, respectively. Fig. 1 shows the
stratified age distribution of prevalence of the clusters of risk
factors. Prevalence of clusters of two, three, and four or more
risk factors was 23.1, 15.5 and 8.4%, respectively.
The number and burden of risk factors (cluster) increased
with age (Table 2, Fig. 2), and women had higher clustering of
cardiovascular risk factors (
p
=
0.001) (Fig. 2). Selecting some risk
factors, as shown in Fig. 4, participants with microalbuminuria
had greater clusters of cardiovascular risk factors than those
with normal values (21.2 vs 3.3%,
p
=
0.01). Similarly, as shown
in Fig. 3, those with obesity (BMI
>
30 kg/m
2
) (
p
=
0.001)
and diabetes (
p
=
0.001) had more clusters (three or more) of
cardiovascular risk factors.
Multivariate analysis (Table 3) between the selected risk
factors and clustering of two or more risk factors showed
Table 1. Demographic, clinical and laboratory parameters
of the participants by gender
Variables
n
Male
(mean
±
SD)
Female
(mean
±
SD) Total
p
-value
Mean age (years)
1083 51.8
±
21.4 57.0
±
18.7 55.1
±
19.9
<
0.01
BMI (kg/m
2
)
1083 22.7
±
19.5 24.0
±
22.3 23.6
±
21.4 0.28
WC (cm)
1083 80.7
±
9.9 84.5
±
12.5 83.2
±
11.8
<
0.01
TC (mmol/l)
1083 3.4
±
1.1
3.4
±
1.1 3.4
±
1.1 0.8
LDL-C (mmol/l)
1083
1.5
1.6
1.6
<
0.01
HDL-C (mmol/l)
1083
1.0
1.0
1.0
0.5
TG (mmol/l)
1083
1.0
0.9
0.9
<
0.01
Serum uric acid (mg/dl) 1083
8.4
6.7
6.7
<
0.01
SBP (mmHg)
1083 136.0
±
25.4 137.5
±
27.4 137.0
±
26.8 0.3
DBP (mmHg)
1083 78.1
±
13.6 80.1
±
13.3 79.4
±
13.4
<
0.01
Urine ACR (mg/g)
754
15.0
20.0
20.0
0.05
FPG (mmol/l)
689 102.2
±
30.5 98.2
±
28.4 99.7
±
29.3 0.08
BMI: body mass index, WC: waist circumference, TC: total cholesterol, LDL-C:
low-density lipoprotein cholesterol, HDL-C: high-density lipoprotein cholesterol,
TG: triglycerides, SBP: systolic blood pressure, DBP: diastolic blood pressure,
ACR: albumin–creatinine ratio, FPG: fasting plasma glucose.
Table 2. Stratification of clustering of cardiovascular risk factors and
mean values of selected risk factors among the participants
Variables*
n
No risk
factor
1 risk
factor
2 risk
factors
3 risk
factors
≥
4 risk
factors p-value
Age (years)
1083 47.4
±
21.3 49.9
±
21.1 57.1
±
19.4 64.8
±
15.7 63.5
±
14.0
<
0.01
WC (cm)
1067 77.5
±
7.3 78.5
±
8.4 83.5
±
11.4 87.2
±
12.6 94.2
±
12.1
<
0.01
BMI (kg/m
2
)
1078 20.8
±
2.1 21.3
±
3.0 22.1
±
3.9 24.2
±
6.9 26.8
±
5.8
<
0.01
SBP (mmHg)
1070 124.0
±
20.4 128.2
±
23.8 138.7
±
26.3 151.1
±
27.2 155.8
±
26.4
<
0.01
DBP (mmHg)
1070 73.7
±
10.5 75.4
±
11.7 80.0
±
13.2 85.4
±
15.1 87.1
±
11.6
<
0.01
TC (mmol/l)
1083 3.6
±
0.9 3.3
±
1.0 3.3
±
1
3.4
±
1.1 3.4
±
1.5 0.04
LDL-C (mmol/l) 1083 1.5
±
0.7 1.6
±
0.8 1.6
±
0.7 1.8
±
0.9 1.9
±
1.2
<
0.01
HDL-C (mmol/l) 1083 1.5
±
0.6 1.0
±
0.5
1
±
0.4 0.9
±
0.4 0.8
±
0.4
<
0.01
TG (mmol/l)
1083 1.2
±
0.9 1.2
±
0.8 1.2
±
0.8 1.1
±
0.8 1.1
±
0.8 0.58
TC/HDL-C 1083 2.8
±
1.4 3.2
±
2.5 3.3
±
2.1 3.7
±
2.5 4.1
±
2.8 0.01
FBG (mmol/l)
608 5.0
±
0.8 5.3
±
0.9 5.4
±
1.2 5.7
±
2.1 6.4
±
2.9
<
0.01
*Mean of the variables
±
SD.
BMI: body mass index, SBP: systolic blood pressure, DBP: diastolic blood pressure, TC: total
cholesterol, LDL-C: low-density lipoprotein cholesterol, HDL-C: high-density lipoprotein choles-
terol, TC: total cholesterol, FPG: fasting plasma glucose.
18–39
40–59
60–79
>80
Age groups of participants
Clustered risk factors
70
60
50
40
30
20
10
0
2 risk factors
1 risk factor
3 risk factors
p
=
0.001
Fig. 1.
Age groups of participants and clustering of cardiovas-
cular risk factors.