


 55 / 70

CARDIOVASCULAR JOURNAL OF AFRICA • Volume 27, No 5, September/October 2016
AFRICA
325
increasing odds of clustering with increased age 1.07 (95% CI:
1.30–6.67), SBP 1.07 (95% CI: 1.04–1.10), DBP 1.06 (95% CI:
1.00–1.11) and BMI 1.18 (95% CI: 1.02–1.37).
Discussion
This study has shown a high prevalence of cardiovascular risk
factors and clustering of these risk factors among the study
population. We found a prevalence of 32.9 and 8% of two and
at least three cardiovascular risk clusters, respectively. Unlike in
developed countries, but as seen in this study, the economically
productive age groups were more affected.
The co-existence and synergistic effects of clusters of risk
factors may explain the high burden and poor outcome of
cardiovascular events such as stroke and death among blacks.
15-19
The rapidity of lifestyle changes, increased market globalisation
and the genetic make-up of the population could also explain
this high prevalence. This is disturbing because the majority of
people in the country have a low socio-economic status, with
84% earning N20 000 ($120) or less per month. The economic
and social impact of cardiovascular disease would therefore be
heavy on a developing country such as Nigeria if this trend is
sustained.
With clustering of risk factors and increased clustering
among the participants, the mean values of the risk factors
were observed to be significantly related. There is a high rate
of undiagnosed cardiovascular risk factors in Nigeria and the
sub-region.
8,9
The earlier the diagnosis is made the better the
outcome, as this prevents progression to atherosclerosis, and
worsening of non-conventional cardiovascular risk factors and
associated end-organ damage, which is usually irreversible. This
calls for regular screening and comprehensive examination of
patients at every opportunity.
Studies have shown the impressive results of early intervention
programmes.
20
Lifestyle changes and/or the use of medications to
treat hypertension, for instance, would reduce morbidity and
mortality rates.
21,22
Nowadays, diets that are rich in saturated fats
and refined carbohydrates and low in vegetables, and increasing
sedentary lifestyles are replacing traditional diets.
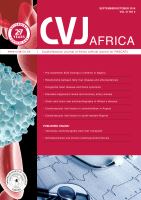
Males had a higher prevalence of a single risk factor, however,
females had more clustering than males. This became more
marked at middle age when clustering was more than doubled
(Fig. 1). Our study showed significantly higher prevalence of
low HDL-C, high LDL-C and triglyceride levels, obesity, and
diastolic and systolic hypertension among women than men.
These physiological mechanisms, in association with changes in
their hormone levels with age, may be contributory.
In a similar community study conducted by Oladapo
et al.,
9
more women than men had a high prevalence of clustering of
risk factors. More men than women had high blood pressure
until 45 years of age but thereafter women caught up and later
surpassed men in prevalence and occurrence of hypertension,
coronary heart disease and stroke.
20-23
Studies have also shown
that females reported less physical activity than males.
24,25
In this study, the higher the number of clustered risk factors,
the higher the mean values of the risk factors. This suggests the
Table 3. Multivariate adjusted analysis of cardiovascular
risk factors and clustering of risk factors
Variables
B
p
-value
Exp
95% CI
Gender
1.080
0.01
2.94
1.30–6.67
Age
0.097
<
0.01
1.10
1.07–1.13
SBP
0.070
<
0.01
1.07
1.04–1.10
DBP
0.054
0.01
1.06
1.00–1.11
WC
0.034
0.183
1.04
0.98–1.08
BMI
0.166
0.029
1.18
1.02–1.37
TC
0.160
0.40
1.17
0.81–1.71
HDL-C
–1.829
<
0.01
0.16
0.06–0.41
LDL-C
0.262
0.180
1.30
0.89–1.90
FPG
0.029
0.005
1.03
1.00–1.05
ACR
0.033
0.007
1.03
1.00–1.05
SBP: systolic blood pressure, DBP: diastolic blood pressure, WC: waist circum-
ference, BMI: body mass index, TC: total cholesterol, HDL-C: high-density
lipoprotein cholesterol, LDL-C: low-density lipoprotein cholesterol, FPG: fast-
ing plasma glucose, ACR: albumin–creatinine ratio.
1 risk factor
2 risk factors 3 risk factors
Clustered risk factors
Prevalence of clustered
cardiovascular risk factors
50
45
40
35
30
25
20
15
10
5
0
Male
Female
p
=
0.001
Fig. 2.
Distribution of cardiovascular risk factors cluster
between men and women.
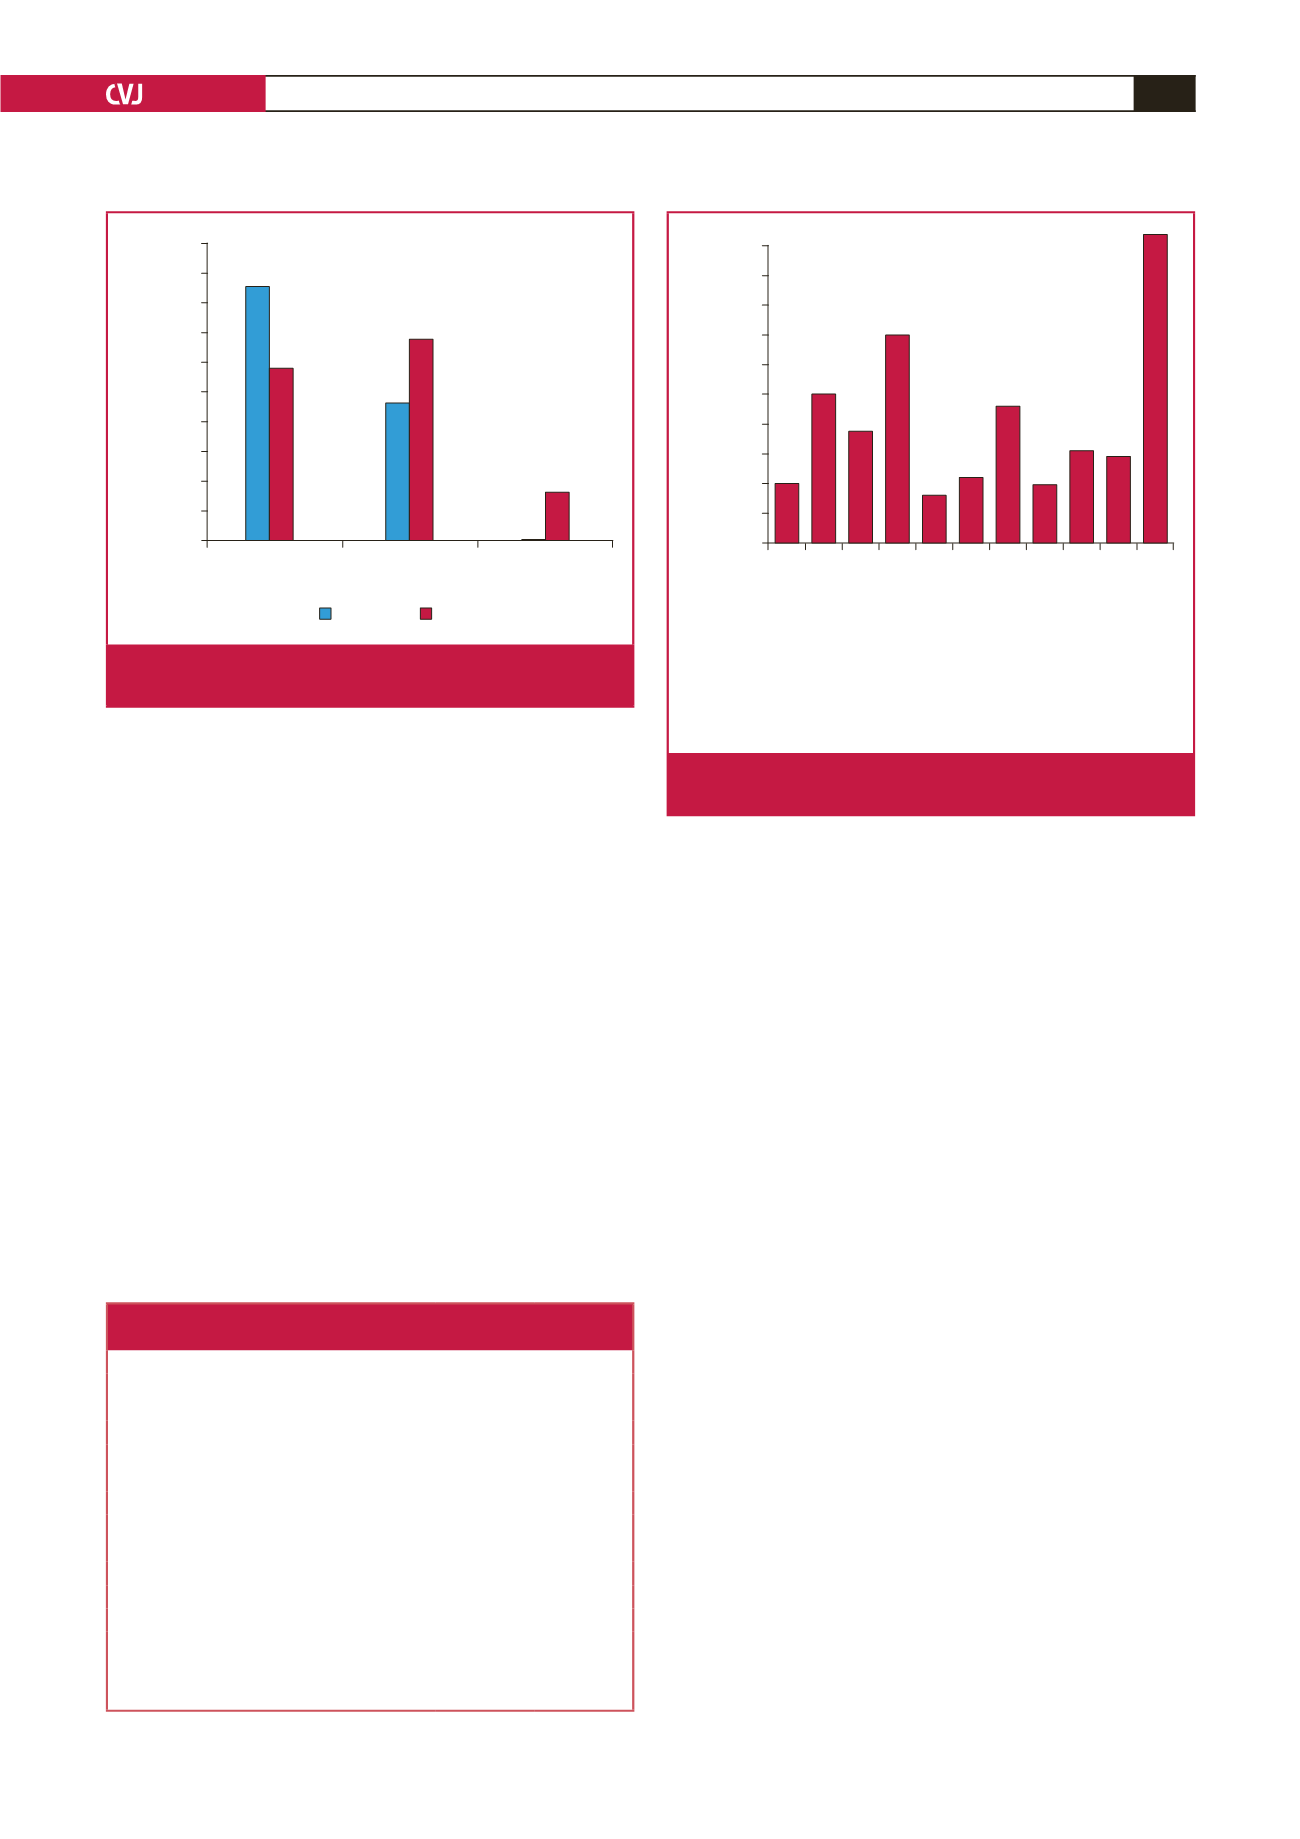
Prevalence of clustered risk factors
for selected cardiovascular factors
50
45
40
35
30
25
20
15
10
5
0
Age
Abdominal obesity
Microalbuminuria
Diabetes
Impaired fasting glucose
Low HDL-C
Elevated cholesterol
Diastolic hypertension
Systolic hypertension
Overweight
Obesity by BMI
Fig. 3.
Selected cardiovascular risk factors and weight of
clustering of other risk factors.