
CARDIOVASCULAR JOURNAL OF AFRICA • Volume 29, No 3, May/June 2018
186
AFRICA
In a Nigerian study by Okeahialam
et al
.
17
in 70 hypertensives,
70 diabetics and 71 non-diabetic non-hypertensive controls
aged 30 years and older at a teaching hospital in north-central
Nigeria, the prevalence of CA in their population was 47.5% for
diabetics, 48.9% for hypertensives and 36.5% for the controls.
They did not find any significant difference in CIMT between
the subjects with hypertension and DM and the controls,
although they found a reasonable degree of CA in their controls.
Therefore they suggested that there is a need to evaluate for other
traditional risk factors other than hypertension and DM, and for
novel emerging risk factors.
In our cross-sectional study, we evaluated for more traditional
risk factors than just hypertension and DM, and our subjects had
at least one CVRF. Comparing our subjects to controls who had
no traditional CVRFs may have shown significant differences
in CIMT between the two groups, as has been demonstrated by
other researchers.
6,7
In the present study, CIMT increased with advancing age
until the seventh decade, after which it decreased. However, the
difference between CIMT in the seventh and eighth decades
was not statistically significant on
post hoc
analysis (
p
>
0.05).
Also, 70.1 and 84.6% of subjects with increased CIMT and CP,
respectively, were
≥
50 years of age. Ayoola
et al.
,
18
in a previous
study in the same location as ours in 200 hypertensives with a
mean age of 58.8
±
11.6 years and 100 controls with a mean age of
Table 3. Association between risk factor variables and increased CIMT
Variable
Normal CIMT
(%)
Increased CIMT
(%)
Bivariate model
Logistic regression model
Nagelkerke
R
2
=
0.787
UOR
95% CI
p
-value
AOR
95% CI
p-
value
Age
≥
50 years
21 (28.0)
62 (71.3)
6.38
3.2– 12.66
<
0.001
0.048
0.01–0.23
<
0.001
Gender (male)
36 (48.0)
44 (50.6)
1.11
0.598–2.056
0.744
NI
NI
NI
Obesity
10 (13.3)
46 (52.9)
7.293
3.317–16.032
<
0.001
0.163
0.03–0.77
0.022
Hypertension
10 (13.3)
70 (80.5)
26.77
11.43–62.68
<
0.001
0.035
0.008–0.149
<
0.001
Diabetes mellitus
10 (13.3)
36 (41.4)
4.59
2.08–10.12
<
0.001
0.20
0.037–1.07
0.060
Dyslipidaemia
32 (42.7)
79 (90.8)
13.27
5.62–31.32
<
0.001
0.03
0.02–0.428
0.009
Abnormal TC
15 (20.0)
48 (55.2)
4.92
2.43–9.98
<
0.001
0.99
0.17–5.60
0.987
Abnormal TG
23 (30.7)
66 (75.9)
7.11
3.55–14.23
<
0.001
11.68
1.12–122.1
0.040
Abnormal LDL-C
24 (32.0)
57 (65.5)
4.04
2.09–7.78
<
0.001
3.92
0.51–30.12
0.190
Abnormal HDL-C
3 (4.0)
17 (19.5)
5.83
1.64–20.77
0.003
0.83
0.11–6.39
0.859
Smoking
4 (5.3)
21 (24.1)
5.65
1.84–17.32
0.001
0.146
0.02–1.08
0.059
Alcohol
7 (9.3)
38 (43.7)
7.53
3.11–18.30
<
0.001
0.067
0.01–0.36
0.002
Chronic kidney disease
8 (10.7)
24 (27.6)
3.19
1.34–7.62
0.007
0.729
0.14–3.71
0.703
CIMT: carotid intima–media thickness, CI: confidence interval, TC: total cholesterol, TG: triglycerides, LDL-C: low-density lipoprotein cholesterol, HDL-C: high-
density lipoprotein cholesterol, UOR: unadjusted odds ratio, AOR: adjusted odds ratio.
Table 4. Association between risk factor variables and presence of plaques
Variable
Plaque (
–
)
(%)
Plaque (+)
(%)
Bivariate model
Logistic regression model
Nagelkerke
R
2
=
0.380
UOR
95% CI
p
-value
AOR
95% CI
p
-value
Age
≥
50 years
61 (44.9)
22 (84.6)
6.76
2.21– 20.67
<
0.001
0.21
0.06–0.73
0.014
Gender (male)
67 (49.3)
13 (50.0)
1.03
0.45–2.38
0.945
NI
NI
NI
Obesity
40 (29.4)
16 (61.5)
3.84
1.61–9.18
0.002
0.50
0.18–1.41
0.191
Hypertension
57 (41.9)
23 (88.5)
10.63
3.04–37.10
<
0.001
0.30
0.008–1.21
0.041
Diabetes mellitus
35 (25.7)
11 (42.3)
2.12
0.89–5.04
0.086
NI
NI
NI
Dyslipidaemia
86 (63.2)
25 (96.2)
14.54
1.92–110.55
0.001
0.18
0.01–2.81
0.220
Abnormal TC
44 (32.4)
19 (73.1)
5.68
2.22–14.50
<
0.001
0.22
0.05–1.08
0.063
Abnormal TG
67 (49.3)
22 (84.6)
5.66
1.85–17.30
0.001
1.42
0.27–7.60
0.681
Abnormal LDL-C
63 (46.3)
18 (69.2)
2.61
1.06–6.40
0.032
2.57
0.52–12.70
0.248
Abnormal HDL-C
13 (9.6)
7 (26.9)
3.49
1.23–9.84
0.014
0.64
0.19–2.13
0.468
Smoking
20 (14.7)
5 (19.2)
1.38
0.47–4.09
0.558
NI
NI
NI
Alcohol
34 (25.0)
11 (42.3)
2.20
0.92–5.25
0.071
NI
NI
NI
Chronic kidney disease
24 (17.6)
8 (30.8)
2.07
0.81–5.32
0.124
NI
NI
NI
Plaque (–): plaque absent, plaque (+): plaque present, CI: confidence interval, TC: total cholesterol, TG: triglyceride, LDL-C: low-density lipoprotein cholesterol,
HDL-C: high-density lipoprotein cholesterol, UOR: unadjusted odds ratio, AOR: adjusted odds ratio.
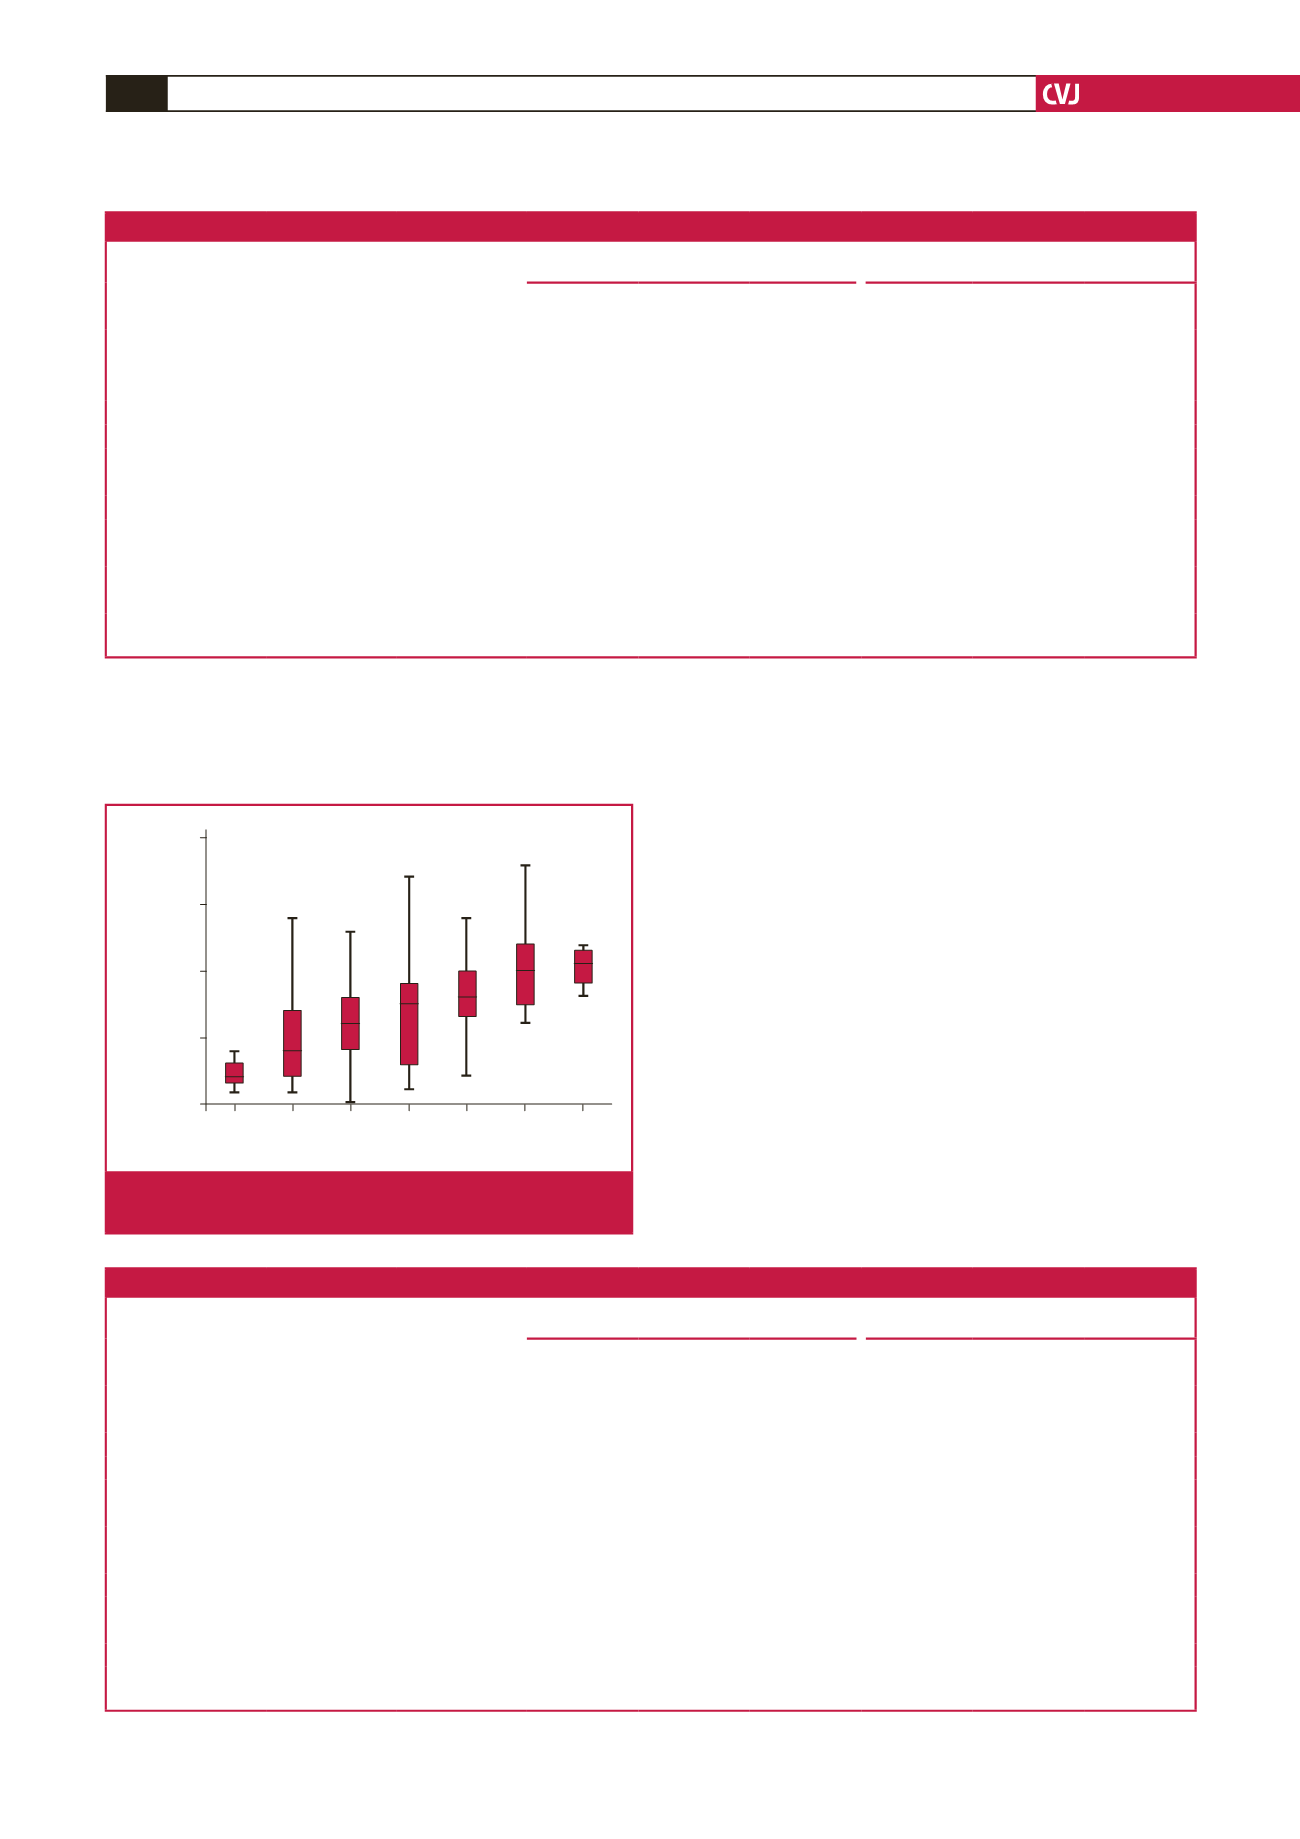
CV risk burden
1.00 2.00 3.00 4.00 5.00 6.00 7.00
Average CCA IMT
2.50
2.00
1.50
1.00
0.50
Fig 1.
Box plots showing the relationship between CIMT and
the number of CVRFs.


