


 24 / 74

CARDIOVASCULAR JOURNAL OF AFRICA • Volume 29, No 5, September/October 2018
286
AFRICA
a 10% increased risk of developing DD (OR
=
1.10, 95% CI:
1.03–1.17,
p
=
0.003). The area under the receiver operating curve
of this model was 0.76, suggesting a good model.
Discussion
In this study, LVDD occurred significantly more frequently in
the diabetic groups with or without MCA compared with the
controls (
p
<
0.001) and the prevalence of LVDD in both diabetic
groups were within the range of 40 to 75% reported by studies
done on normotensive diabetics within
16
and outside the country.
17
Grade 1 LVDD was the commonest, which was significantly
more in the microalbuminuric than the normoalbuminuric group
and was the only grade seen in the controls (
p
<
0.01). Aigbe
et
al.
16
and Patil
et al
.
17
reported similar findings. Higher grades (2
and 3), although rare, were commoner in the microalbuminuric
(8.5%) than the normoalbuminuric group (6.4%).
Lower rates of LVDD were reported by Liu
et al
.
18
among
American Indians with T2DM, 16% in normo-, 26% in micro-
and 31% in the macroalbuminuric groups, because diastolic
function assessment was based on only transmitral flow
parameters, with no distinctions made between normal and
grade 2 DD. Therefore, patients with a pseudo-normalised
pattern were not included in their analysis.
Systolic dysfunction was rare among the normotensive
T2DM patients, which is similar to a previous report.
3
A higher
value of 15.56% reported by Dodiyi-Manuel
et al
.
5
may be due
to the higher EF cut-off value of 55% used to define systolic
dysfunction, thus suggesting that systolic dysfunction detected
by conventional echocardiography is not an early feature of
DMCMP. This supports the assumption that alteration of
both relaxation and filling usually precede marked changes in
chamber systolic function, although more sophisticated imaging
technology such as speckle-tracking imaging (STI), used to assess
myocardial strain and strain rate, have permitted the detection of
subtle systolic dysfunction in the diabetic myocardium.
19
The significant correlation of E/A ratio with age (
p
<
0.001), creatinine level (
p
=
0.009) and eGFR (
p
=
0.008) in the
normotensive T2DM patient suggests a worsening of LVDD
as the patient grows older and serum creatinine level rises as a
result of decline in renal function. Danbauchi
et al
.
20
reported
a significant correlation of LVDD with age, fasting blood
glucose and two-hour postprandial glucose level in T2DM
patients. Likewise, Yazici
et al
.
21
in their study on 76 T2DM
patients of Turkish origin documented that E/A ratio correlated
significantly with age, glycated haemoglobin (HbA
1c
) level and
duration of diabetes. These observations suggest that aging
and impairment of renal function correlate with LVDD in
normotensive diabetics.
The relationship between microalbuminuria and asymptomatic
LVDD in T2DM patients has been a subject of much debate.
In this study, a worsening of diastolic function as evidenced by
significantly higher A velocity, lower E velocity and E/A ratio,
larger left atrial dimension and longer IVRT were observed in the
microalbuminuric compared to normoalbuminuric group. Baykan
et al
.
22
also reported significantly longer deceleration time and
IVRT in the microalbuminuric than the normoalbuminuric group.
Table 3. Correlation coefficient of clinical and biochemical
variables compared with E/A ratio and IVRT in normotensive
diabetic subjects (
p
<
0.05)
E/A ratio
IVRT
Parameters
Rho
p
-value
Rho
p
-value
Age (years)
–0.45
<
0.001
0.06
0.55
DM duration (years)
–0.06
0.51
0.14
0.15
Weight (kg)
0.11
0.24
0.08
0.39
Body surface area (m
2
)
0.13
0.16
0.09
0.34
Body mass index (kg/m
2
)
0.06
0.49
–0.03
0.77
Waist circumference (cm)
–0.03
0.77
0.15
0.12
Hip circumference (cm)
0.004
0.97
0.06
0.55
Waist:hip ratio
–0.09
0.35
0.05
0.61
Systolic BP (mmHg)
–0.04
0.65
–0.01
0.91
Diastolic BP (mmHg)
0.14
0.15
–0.06
0.53
Pulse pressure
–0.14
0.12
0.02
0.86
Pulse rate (beat/min)
–0.11
0.22
–0.26
0.005
Creatinine (mg/dl)
–0.32
0.009
0.19
0.13
eGFR (ml/min)
0.33
0.008
–0.09
0.47
Total cholesterol (mmol/l)
–0.16
0.25
–0.13
0.36
Trigylcerides (mmol/l)
0.01
0.91
0.32
0.01
HDL-C (mmol/l)
0.02
0.87
–0.08
0.57
LDL-C (mmol/l)
–0.07
0.60
–0.04
0.76
Rho: correlation coefficient, DM: diabetes mellitus, eGFR: estimated glomeru-
lar filtration rate, HDL-C: high-density lipoprotein cholesterol, LD-C: low-
density lipoprotein cholesterol.
Table 4. Logistic regression model to determine predictors of left
ventricular diastolic dysfunction in the normotensive diabetic subjects
Variable
Univariate analysis
Multivariate analysis
Odds ratio
(95% CI)
p
-value
Odds ratio
(95% CI)
p
-value
Age
1.11 (1.04–1.17)
<
0.001
*
1.10 (1.03–1.17)
0.003
*
Microalbuminuria 3.58 (1.99–6.82)
<
0.001
*
1.81 (0.70–4.68)
0.222
Gender
0.69 (0.31–1.55)
0.309 0.56 (0.21–1.48)
0.240
BMI
0.98 (0.90–1.07)
0.719 0.91 (0.79–1.06)
0.227
Waist
1.01 (0.98–1.06)
0.452 1.04 (0.97–1.12)
0.263
DM duration
1.10 (0.96–1.24)
0.142 1.04 (0.90–1.19)
0.599
Systolic BP
1.01 (0.95–1.05)
0.824 0.98 (0.91–1.06)
0.694
Diastolic BP
0.96 (0.89–1.03)
0.234 0.97 (0.87–1.08)
0.598
Receiver operating curve 0.76, CI: confidence interval, DM: diabetes mellitus,
BP: blood pressure.
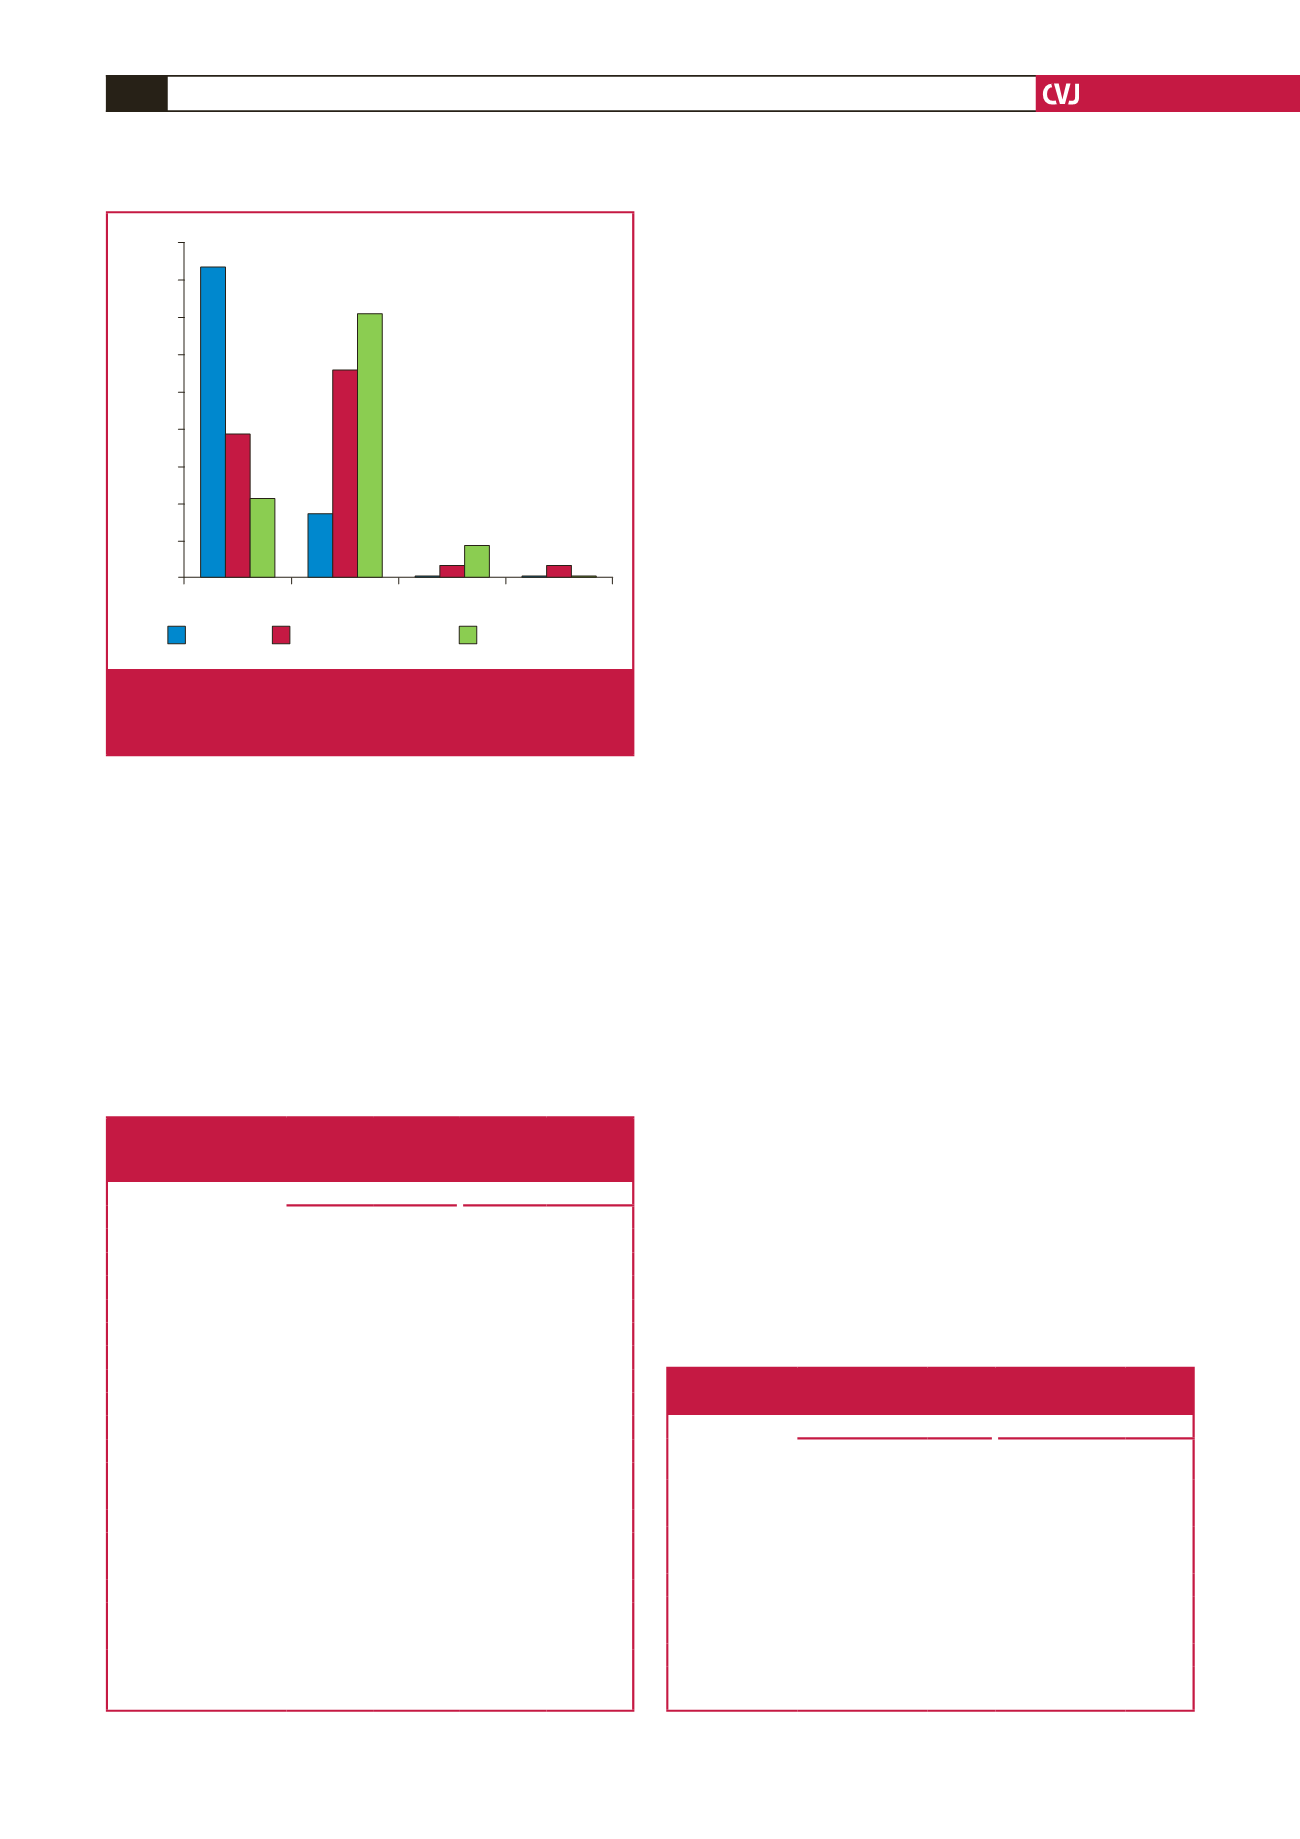
Normal
Impaired
relaxation
Pseudo-
normalisation
Restrictive
pattern
Proportion of subjects (%)
90
80
70
60
50
40
30
20
10
0
Control
Normalalbuminuria
Microalbuminuria
χ
2
=
50.15,
p
<
0.001
Fig. 1.
Composite bar chart showing the prevalence and
pattern of left ventricular diastolic dysfunction among
the three groups.