


 31 / 74

CARDIOVASCULAR JOURNAL OF AFRICA • Volume 30, No 2, March/April 2019
AFRICA
97
coefficient. Briefly, 25
μ
l of 4-mM butylated hydroxytoluene and
200
μ
l of ortho-phosphoric acid was added to 200
μ
l of each
plasma sample in 5-ml macrotube 5 tubes (MTCBio: Lasec, SA)
and vortexed for 10 seconds. Twenty-five
μ
l of thiobarbituric
acid reagent was added, the tubes were vortexed as before and
incubated at 90
o
C for 45 minutes, prior to cooling on ice. TBARS
were extracted into 500
μ
l of butanol per tube, using saturated
NaCl to facilitate phase separation. Each tube was centrifuged
at 2 000 ×
g
for one minute and the absorbance was read at 532
nm. The concentrations of TBARS were normalised to TG +
PL concentrations.
Directly after sacrifice of each rat, the total cholesterol (TC)
level was measured with the Cardiocheck PA
®
system (Polymer
Technology Systems Inc, Indianapolis, USA), as previously
described. This entailed a capillary being filled with blood and
introduced into the analyser.
30
Isolated rat heart perfusion technique and protocols
Myocardial ischaemic tolerance was determined by means of a
regional ischaemia protocol to assess infarct development, and
global ischaemia to assess functional recovery. In both protocols,
hearts were mounted on the perfusion system and subjected to
10 minutes of retrograde perfusion in Langendorff mode at a
constant pressure, followed by 20 minutes of working-heart mode
at a preload of 15 cm H
2
O and an afterload of 100 cm H
2
O.
Perfusions were performed with KHB. During mounting, the
aortic cannula was inserted into the aorta and the second cannula
into the left pulmonary vein to perfuse the heart via the left
atrium during the 10 minutes of working-heart perfusion. The
pressure transducer was inserted into the aortic outflow tract.
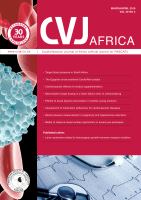
Regional ischaemia was induced for 35 minutes by ligation
of the proximal left anterior descending coronary artery with a
silk surgical suture. After 35 minutes, the ligature was loosened
and reperfusion followed for 60 minutes (Fig. 1A). To measure
risk zone and infarct size, the heart was stained with 0.5%
Evan’s Blue dye solution (Sigma, St Louis, MO, USA), frozen
overnight and then cut into 2-mm slices. Slices were incubated
with 1% w/v triphenyltetrazoliumchloride (TTC) [Merck (Pty)
Ltd (Darmstadt, Germany)] in phosphate buffer solution for 15
minutes (pH 7.4) before being placed in 10% formalin.
The slices were analysed with computerised planimetry
(UTHSCSA Image Tool program, University of Texas Health
Science Center, San Antonio, Texas). Infarct size (IS) was
expressed as a percentage of the area at risk (%AAR).
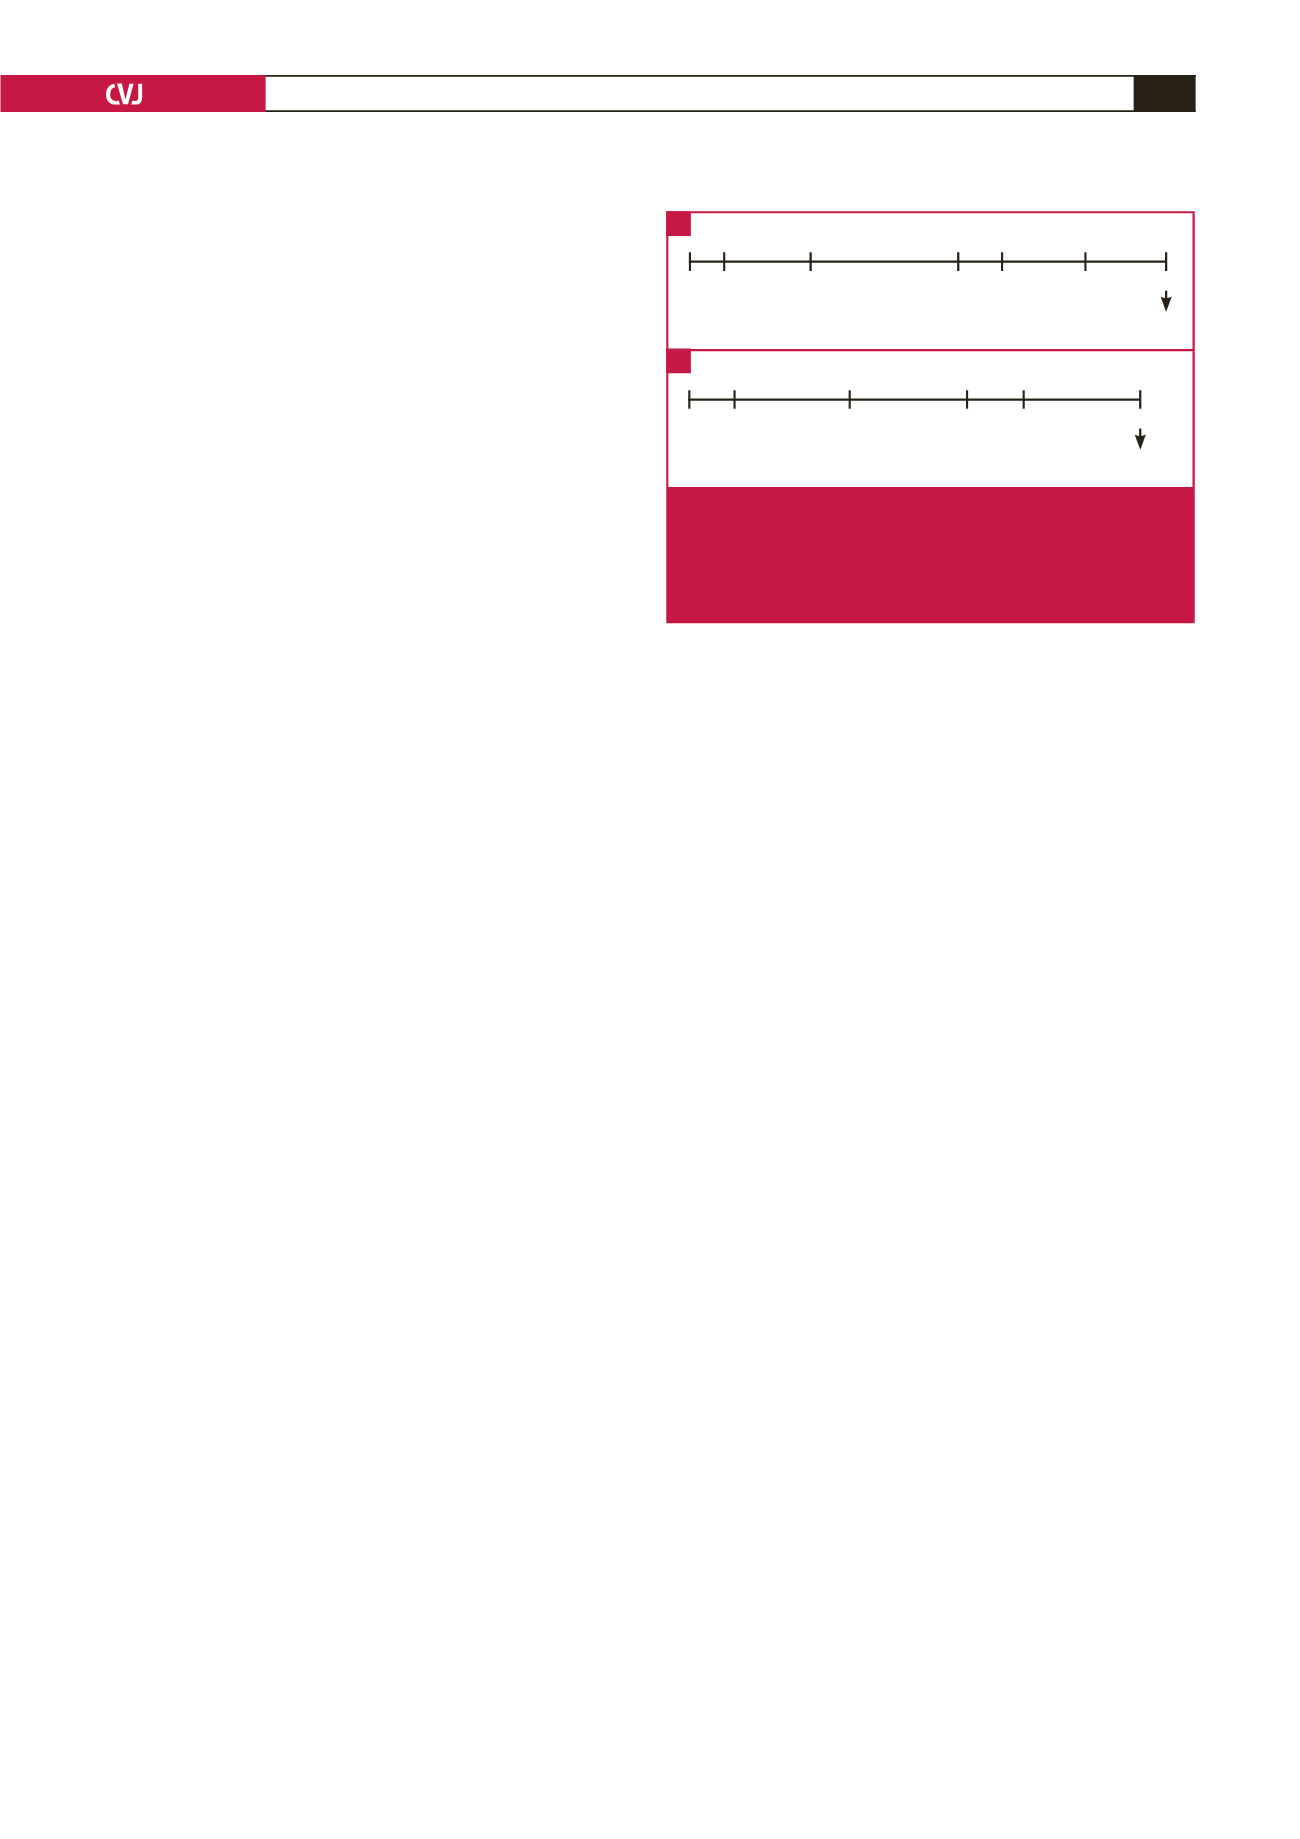
To induce global ischaemia, perfusion to the heart was
completely shut off (coronary flow rate
=
0 ml/min) for 20
minutes at a constant temperature of 36.5°C. This was followed
by 30 minutes of reperfusion and freeze clamping (Fig. 1B). The
parameters recorded and calculated to determine mechanical
function were: coronary flow rate (CF; ml/min), aortic output
(AO; ml/min), peak systolic and diastolic pressures (PSP and
PDP; mmHg), and heart rate (HR; bpm) recorded with a Viggo-
Spectramed pressure transducer coupled to a computer system.
The parameters were measured at the 20-minute baseline, and
again at the end of the 30-minute recovery in working-heart
mode. Cardiac output (CO) was calculated as follows:
CO (ml/min)
=
CF + AO.
Total work (TW) was calculated as a function of the CO and PSP:
TW
=
CO × PSP × 0.0022.
31
Experimental protocol for vascular reactivity studies
After excision, the aorta was cleaned by removing all surrounding
connective tissue and perivascular adipose tissue (PVAT). Great
care was taken not to damage or stretch the aorta while cleaning.
Next, a 3–4-mm ring segment was cut out and mounted between
two steel hooks, one of which was connected to an isometric
force transducer (TRI202PAD, Panlab, ICornellà, BCN, Spain).
The ring was lowered into the organ bath (AD Instruments,
Bella Vista, New South Wales, Australia) filled with 25 ml KHB
and gassed with 95% O
2
and 5% CO
2
at 36.5–37°C. Tension in
the aortic ring was recorded throughout the experiment using
LabChart 7 software (Dunedin, New Zealand), as previously
described in our laboratory.
32
Stock solutions of phenylephrine
(Phe) and acetylcholine (Ach) were prepared daily by dissolving
each drug in a 0.9% saline solution.
The protocol was initiated by a 30-minute stabilising period at
a resting tension of 1.5 g with a KHB change every 10 minutes.
This was followed by a test for contraction and relaxation with
the addition of 100 nM Phe until the Phe-induced contraction
curve reached a plateau, followed by 10
μ
M Ach administration
to induce relaxation. Only rings displaying at least 70%
relaxation of the maximum contraction were used for further
experimentation. At this point, the organ bath was rinsed
three times with fresh KHB, followed by another 30-minute
stabilisation period. KHB was changed with pre-warmed buffer
every 10 minutes.
Following this, aortic ring contraction was evaluated by
adding cumulative concentrations of Phe to the waterbath (final
Phe concentration after each of the five consecutive additions:
100, 300, 500, 800 nM and 1
μ
M). Once the contraction curve
of the final Phe administration reached a plateau, relaxation was
induced by the administration of cumulative Ach concentrations
(final Ach concentration after each addition: 30, 100, 300 nM, 1
and 10
μ
M). The same protocol was followed for control, ART,
rooibos and combination treatment aortas.
Statistical analyses
All data were analysed on GraphPad Prism 5 (GraphPad
Software, San Diego, CA, USA) using either the one-way or
two-way analysis of variance (ANOVA), followed by Bonferroni’s
method for
post hoc
testing between selected groups. Relaxation
L
L
L
WH
Minutes
0 10
30
65 75
125
95
Stain
WH
RI
L
L
WH
0 10
Minutes
30
50 60
80
Freeze clamp
WH
GI
Fig. 1.
Isolated rat heart ischaemia–reperfusion protocols.
(A) Experimental protocol of regional ischaemia.
(B) Experimental protocol of global ischaemia. L:
Langendorff; WH: working heart; RI: regional ischae-
mia; GI: global ischaemia.
A
B