


 32 / 74

CARDIOVASCULAR JOURNAL OF AFRICA • Volume 30, No 2, March/April 2019
98
AFRICA
of rings is expressed as percentage relaxation of the contraction
reached with the final Phe concentration. Differences were
regarded as statistically significant at a
p
-value of
<
0.05;
n
values
are displayed beneath the figures.
Results
Fluid intake was measured weekly per cage and calculated weekly
per group. Although there were no significant differences between
the groups in the weekly fluid intake over the experimental
period, there was a trend for the ART + rooibos group to have
all-round higher fluid consumption.
The rats were weighed at the start of the project, weekly and
at the end of the nine-week protocol. No differences were seen
in absolute body weight gain (weight gain
=
final weight minus
starting weight) (control: 118.9
±
7.09 g; rooibos: 124.1
±
7.11 g;
ART: 108.4
±
7.72 g; ART + rooibos: 119
±
8.77 g) or percentage
weight gain (control: 67.63
±
2.65%; rooibos: 65.45
±
1.55%;
ART: 70.58
±
1.73% and ART + rooibos: 66.92
±
1.95%).
There were no differences in the levels of TG (control: 0.8
±
0.09 mmol/l); rooibos: 0.99
±
0.26 mmol/l; ART: 0.61
±
0.08
mmol/l; ART + rooibos: 0.83
±
0.14 mmol/l), PL (control:
1.57
±
0.07 mmol/l; rooibos: 1.44
±
0.08 mmol/l; ART: 1.54
±
0.10 mmol/l; ART + rooibos: 1.56
±
0.14 mmol/l) and TBARS
(control: 7.69
±
0.55
μ
mol
/
l; rooibos: 7.49
±
0.39
μ
mol
/
l; ART:
7.54
±
0.74
μ
mol
/
l; ART + rooibos: 5.39
±
0.53
μ
mol
/
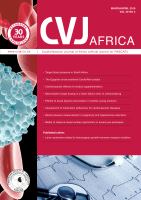
l). TC
levels were, however, significantly decreased in the rooibos group
compared to the controls (control: 3.03
±
0.16 mmol/l; rooibos:
2.48
±
0.05 mmol/l; ART: 2.67
±
0.13 mmol/l; ART + rooibos:
2.61
±
0.16 mmol/l;
p
=
0.05;
n
=
6 per group) (Fig. 2).
Isolated heart perfusions: myocardial function and
infarct size
The pre-ischaemic hearts from ART + rooibos showed
significantly (
p
=
0.007) increased coronary flow rates compared
to the ART group (Table 1). No inter-group differences
were seen in any of the other pre- and post-global ischaemic
functional parameters. There were also no differences observed
in the percentage recovery in any of the parameters (Table
1). Furthermore, following regional ischaemia–reperfusion,
infarct sizes were significantly larger in the ART-treated group
compared to the control (control: 28.17
±
5.10%; rooibos: 39.37
±
5.83%; ART: 50.56
±
4.08%; ART + rooibos: 46.75
±
4.72%;
p
=
0.03: control vs ART) (Fig. 3). No significant inter-group
differences were observed in the percentage area at risk (control:
49.47
±
7.56%; rooibos: 44.29
±
2.00%; ART: 46.29
±
3.71%;
control + ART: 47.94
±
4.45%;
p
> 0.05).
Vascular reactivity studies
In response to Ach, the rings from the ART-treated group
relaxed significantly less compared to both the control aortas (
p
=
0.03) as well as the ART + rooibos group (
p
=
0.003) (Fig. 4).
There were no differences in relaxation between the other groups.
Discussion
Similar to the findings of previous studies, our results showed
that rooibos did not alter body weight or fluid consumption.
33-36
Furthermore, ART alone had no effect on body weight, also
similar to previous findings in humans.
37
Consequently, it was
not unexpected, that the combination of ART and rooibos also
had no effect on body weight.
Previous clinical studies have reported elevated blood lipid
levels in ART-exposed compared to ART-naïve individuals,
depending on the duration and class of ART.
38-40
In a South
African study, patients receiving ART for less than six months
Table 1. Functional parameters of hearts pre-ischaemia and post 20-minute
global ischaemia. *
p
<
0.05 vs rooibos + ART; one-way ANOVA with
Bonferonni
post hoc
test, or Student’s
t
-test where relevant
Mean
±
SEM
Control
(
n
=
9)
Rooibos
(
n
=
9)
ART
(
n
=
9)
Rooibos
+ ART
(
n
=
9)
Aortic output (ml/min)
Pre
37.78
±
1.87 38
±
1.7
33
±
5.85 40.5
±
1.80
Post
10.89
±
3.06 18.67
±
2.92 12.44
±
3.80 13.75
±
3.88
% Aortic output recovery 28.30
±
5.35 47.36
±
4.03 31.08
±
5.89 32.63
±
6.02
Coronary flow (ml/min)
Pre
13.94
±
0.77 12.83
±
0.75 11.63
±
0.90* 15.06
±
0.72
Post
12.06
±
0.52 11.44
±
1.01 9.00
±
2.03 11.75
±
1.33
% Coronary flow recovery 87.87
±
5.00 89.56
±
6.27 76.80
±
17.29 78.51
±
7.95
Cardiac output (ml/min)
Pre
51.72
±
2.37 50.83
±
2.26 44.63
±
6.62 55.56
±
2.10
Post
22.94
±
3.22 30.11
±
3.78 21.44
±
5.51 25.50
±
4.45
% Cardiac output recovery 44.41
±
6.09 57.87
±
5.43 44.80
±
10.3 45.35
±
7.48
Peak systolic pressure
(mmHg)
Pre
88.44
±
0.58 89.22
±
1.11 88.13
±
2.11 90.25
±
0.97
Post
80.89
±
2.32 84.78
±
1.33 62.75
±
13.73 75.75
±
9.54
% Peak systolic pressure
recovery
91.53
±
2.8 95.01
±
0.59 69.99
±
15.32 83.74
±
10.43
Heart rate (bpm)
Pre
280.20
±
13.76 268.20
±
15.71 237.90
±
5.81 263.50
±
6.30
Post
260.80
±
8.67 229.30
±
11.57 187.80
±
41.69 232.60
±
34.34
% Heart rate recovery
94.26
±
4.3 87.02
±
4.89 81.25
±
18.05 88.43
±
12.93
Total work (TW) (mW)
Pre
10.08
±
0.52 10.01
±
0.54 8.85
±
1.44 11.05
±
0.47
Post
4.17
±
0.66 5.68
±
0.77 3.98
±
1.01 4.73
±
0.97
% TW recovery
41.54
±
6.47 55.17
±
5.36 41.96
±
9.77 41.99
±
7.91
Treatment group
Control
Rooibos
ART ART + rooibos
TC (mmol/l)
4
3
2
1
0
*
p
=
0.0481
*
Fig. 2.
Serum total cholesterol (TC) levels at the end of the
nine-week treatment period. One-way ANOVA,
p
<
0.05; Bonferroni
post hoc
test, *
p
=
0.04;
n
=
six per
group.