


 33 / 68

CARDIOVASCULAR JOURNAL OF AFRICA • Volume 31, No 2, March/April 2020
AFRICA
85
to ACh administration when compared to the nicotine- and
NRUF-treated groups (E
max
values of 69.8
±
6.02 and 70.55
±
6.49%, respectively) (Fig. 3B).
Antioxidant enzyme activity
Nicotine has a high affinity for the liver
39
and is also metabolised
by the liver.
40
It has previously been demonstrated that nicotine
treatment resulted in a decrease in SOD
41,42
and CAT
42
activity in
the liver, compared to untreated controls. Our results indicate
that SOD activity in liver tissue homogenates was significantly
increased in the veh control, RF, NMel and NRF groups
compared to the nicotine-treated group. SOD activity was
also increased in the RF and RUF groups compared to the
water control. Additionally, SOD activity in the RF group was
increased when compared to the Mel group (Table 4). CAT
Phe (
μ
M)
0.0 0.1 0.2 0.3 0.4 0.5 0.6 0.7 0.8 0.9 1.0 1.1 1.2 1.3
% Cumulative contraction
150
125
100
75
50
25
0
VEH control
Nicotine
*
ACh (M)
1.0
×
10
-8
3.2
×
10
-8
1.0
×
10
-7
3.2
×
10
-7
1.0
×
10
-6
3.2
×
10
-6
1.0
×
10
-5
3.2
×
10
-5
% Cumulative relaxation
0
20
40
60
80
100
120
VEH control
Nicotine
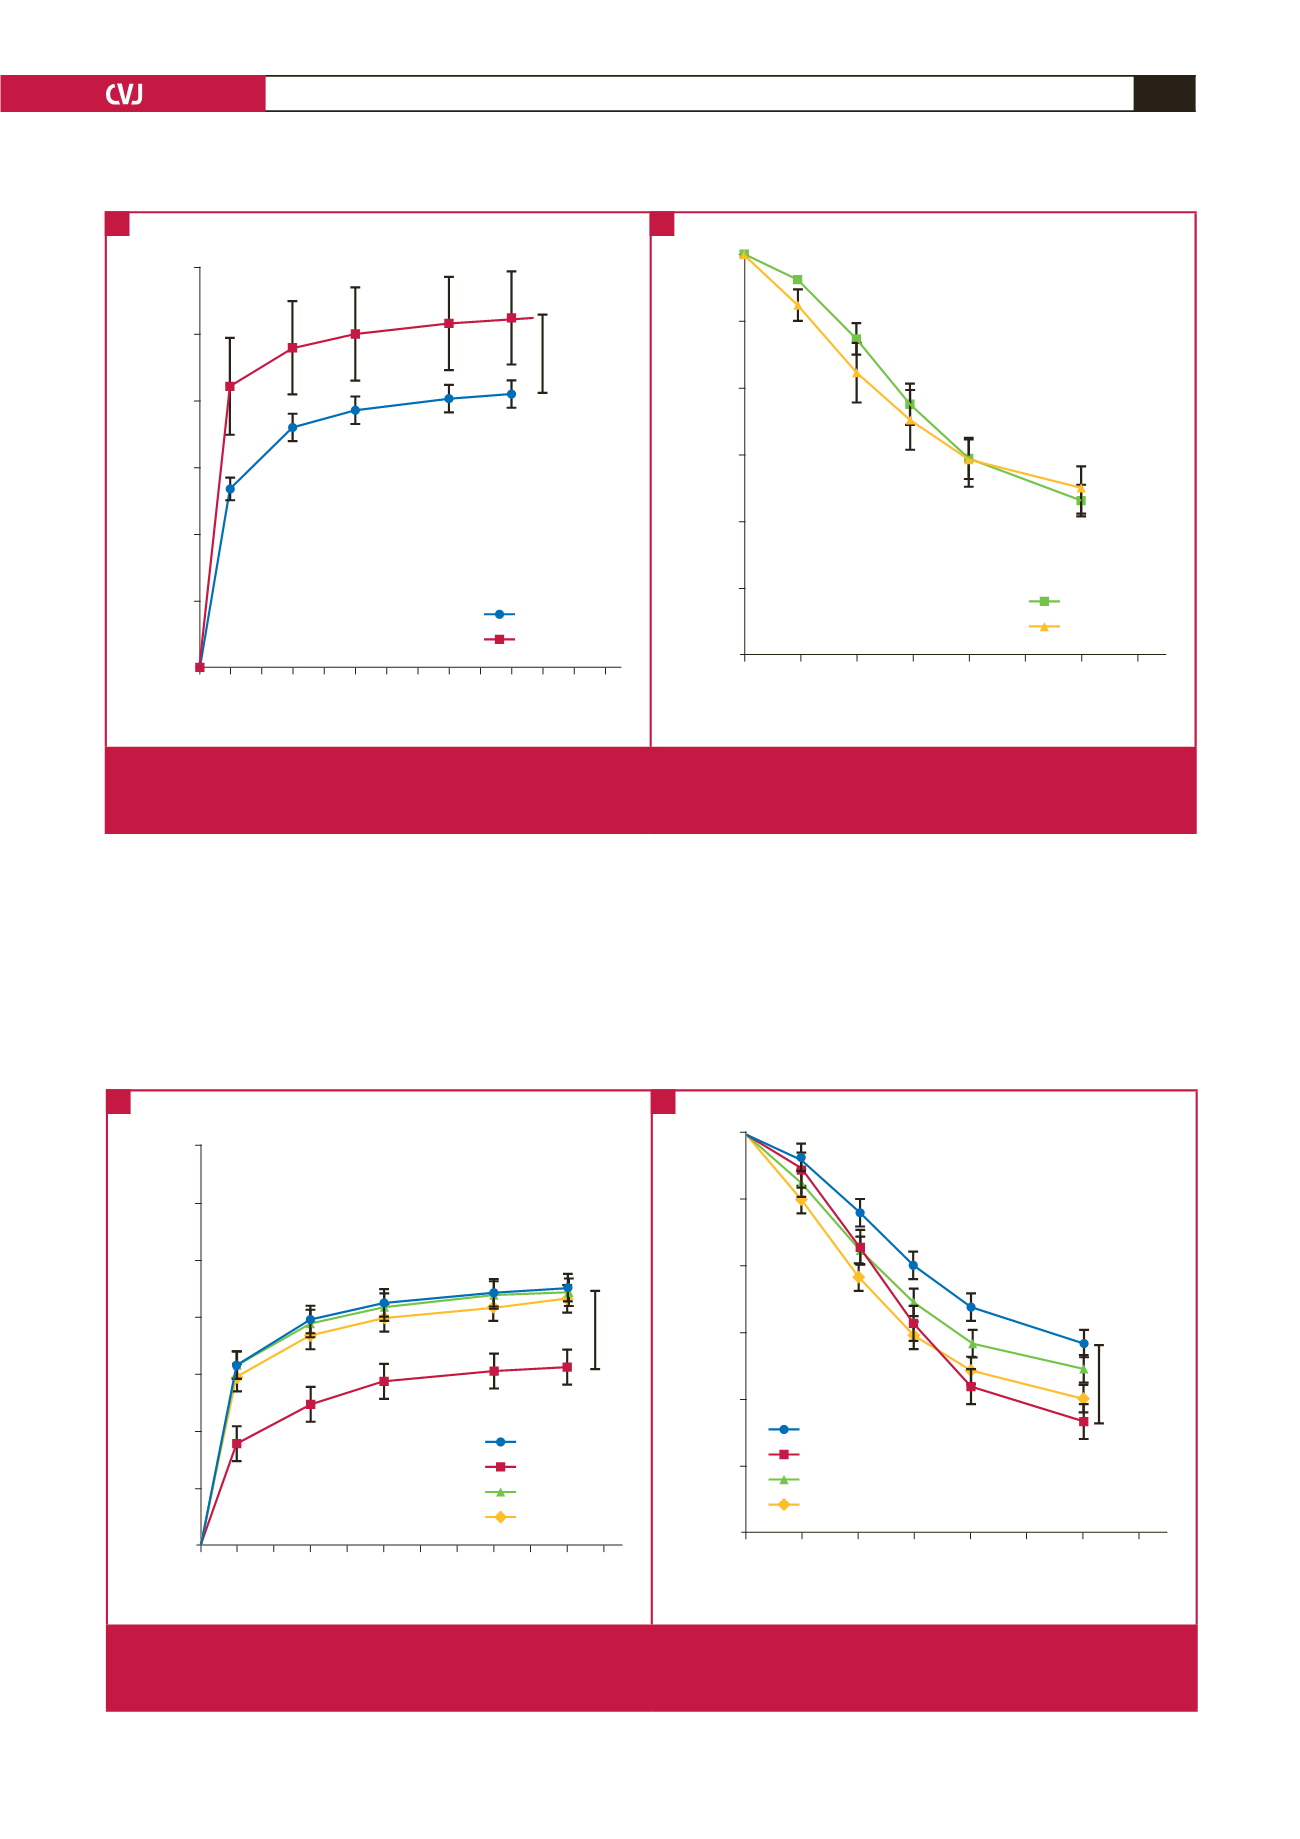
Fig. 1.
(A) Contractile responses of aortic rings harvested from the veh control and nicotine-treated rats following cumulative Phe
administration (*
p
<
0.05 nicotine vs veh control). (B) relaxation response of aortic rings harvested from veh control and
nicotine treated rats following cumulative ACh administration.
A
B
Phe (
μ
M)
0.0 0.1 0.2 0.3 0.4 0.5 0.6 0.7 0.8 0.9 1.0 1.1
% Cumulative contraction
175
150
125
100
75
50
25
0
RF
Water control
RUF
Mel
*
ACh (M)
1.0
×
10
-8
3.2
×
10
-8
1.0
×
10
-7
3.2
×
10
-7
1.0
×
10
-6
3.2
×
10
-6
1.0
×
10
-5
3.2
×
10
-5
% Cumulative relaxation
0
20
40
60
80
100
120
RF
Water control
RUF
Mel
*
Fig. 2.
(A) Contractile responses of aortic rings from Mel, RF, RUF and water control animals following cumulative Phe administra-
tion (*
p
<
0.05 Mel vs RF, RUF and water control). (B) Relaxation response of aortic rings harvested from Mel, RF, RUF and
water control-treated rats following cumulative ACh administration. (*
p
<
0.05 water control vs Mel, RF and RUF).
A
B