


 41 / 64

CARDIOVASCULAR JOURNAL OF AFRICA • Volume 31, No 3, May/June 2020
AFRICA
149
group. There was no significant difference in age, gender, systolic
arterial pressure, diastolic arterial pressure, body mass index,
hypertension, hyperlipidaemia, cigarette and alcohol use and
family history between the groups (
p
> 0.05). However, median
glycated haemoglobin (HbA
1c
) and Gal-3 levels were significantly
higher in patients with isolated CAE compared to the controls (
p
< 0.05). Demographic, clinical and laboratory characteristics of
the study population are shown in Table 1.
Table 2 shows frequency of distribution of ectatic coronary
arteries and the Markis classification in isolated CAE patients.
Ectasia occurred most frequently in the left anterior descending
artery (32%), followed by the circumflex artery (30%), right
coronary artery (26%) and left main coronary artery (15%).
Type 4 was the most common type of ectasia according to the
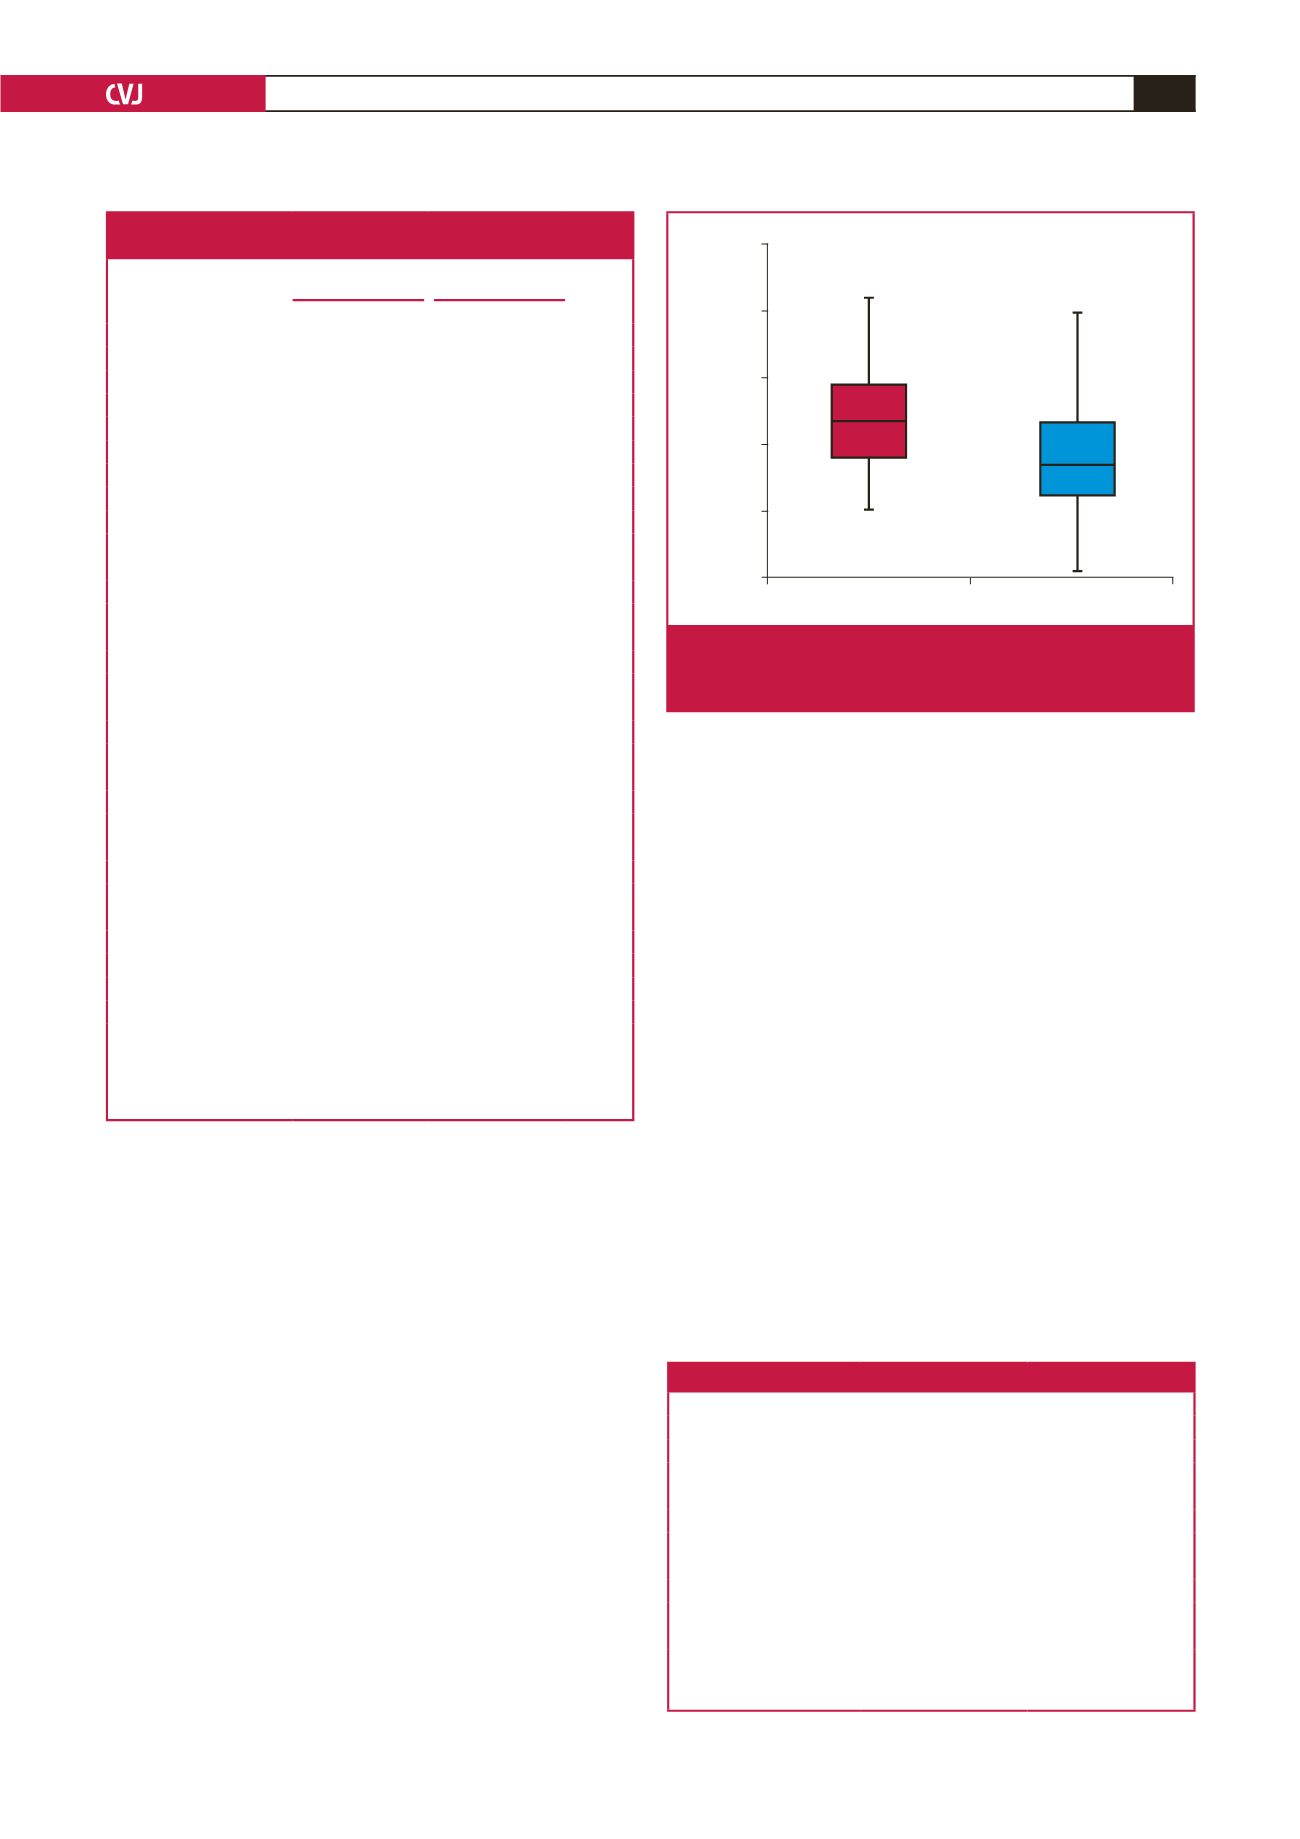
Markis classification in 36% of patients. Median Gal-3 levels
were significantly higher in isolated CAE patients than in the
controls [23.2 (23.9 ± 7.1) vs 16.8 ng/ml (17.8 ± 7.3);
p
< 0.001)
(Table 1, Fig. 1).
In patients with isolated CAE, there was no significant
association between Gal-3 levels and Markis classification or the
number of involved vessels (
p
= 0.41 and 0.093, respectively; Table
3). In univariate analysis, natural log (ln) Gal-3 was found to
have a significant impact for differentiating controls and patients
(
p
< 0.05). Multivariate logistic regression analysis demonstrated
that concentrations of ln Gal-3 were an independent predictor of
isolated CAE (Table 4). In ROC curve analysis, area under the
curve was 0.692 (0.581–0.803) for 16 ng/ml serum Gal-3 cut-off
value (91.8% sensitivity and 46.5% specificity) (
p
< 0.05) (Fig. 2).
Discussion
In this study, we investigated the relationship between serum
Gal-3 levels and isolated CAE. Our results showed significantly
increased Gal-3 levels as a novel cardiac biomarker among
isolated CAE patients, compared to controls. However, there was
no significant association between serum Gal-3 levels and the
extent of isolated CAE.
Despite uncertainties regarding the pathophysiological
mechanisms of CAE, the frequent occurrence of concurrent
CAD and the presence of atheromatous ulcerations in ectatic
segments suggest an important role for atherosclerosis in the
development of CAE.
19
Degeneration in the media layer of
the coronary artery, a common denominator of all conditions
resulting in coronary ectasia, has been reported to be associated
with advanced atherosclerosis.
7,20
Table 1. Baseline demographic, clinical and laboratory
characteristics of the study population
Control group
(
n
= 43)
Patient group
(
n
= 49)
p-
value
Mean ± SD,
n
(%) Mean ± SD,
n
(%)
Age, years
57.2 ± 8.3
60.6 ± 8.2
0.057
t
Gender
Female
24 (55.8)
18 (36.7)
0.067
*
Male
19 (44.2)
31 (63.3)
0.067
*
BMI (kg/m
2
)
31.9 ± 6.2
29.9 ± 0.0
0.084
t
Smoking
12 (27.9)
19 (38.8)
0.271
*
Alcohol
2 (4.7)
1 (2.0)
0.597
*
Hypertension
21 (48.8)
31 (63.3)
0.164
*
Diabetes
7 (16.3)
11 (22.4)
0.457
*
Hyperlipidaemia
13 (46.7)
22 (53.3)
0.148*
Family history
3 (7.0)
9 (18.4)
0.106*
SBP (mmHg)
117.9 ± 14.3
117.5 ± 13.5
0.933
m
DBP (mmHg)
68.9 ± 7.9
68.3 ± 7 .8
0.745
m
Fasting glucose (mg/dl)
110.1 ± 38.3
110.5 ± 34.5
(mmol/l)
(6.11 ± 2.13)
(6.13 ± 1.91)
0.488
m
Creatinine (mg/dl)
0.7 ± 0.2
1.1 ± 2.5
(μmol/l)
(61.88 ± 17.68)
(97.24 ± 221)
0.415
m
Total cholesterol (mg/dl)
200.4 ± 42.5
192.5 ± 60.7
0.790
m
(mmol/l)
(5.19 ± 1.10)
(4.99 ± 1.57)
LDL-C (mg/dl)
120.3 ± 38.0
129.1 ± 41.1
0.360
m
(mmol/l)
(3.12 ± 0.98)
(3.34 ± 1.06)
Triglycerides (mg/dl)
160.8 ± 80.4
143.9 ± 71.2
0.305
m
(mmol/l)
(1.82 ± 0.91)
(1.63 ± 0.80)
hs-CRP (mg/dl)
1.8 ± 1.5
3.2 ± 6.5
0.461
m
Fibrinogen (mg/dl)
305.8 ± 36.5
307.2 ± 76.8
0.554
m
WBC (× 10
3
)
8.1 ± 2.2
7.6 ± 1.8
0.158
m
HDL-C (mg/dl)
47.1 ± 11.8
43.5 ± 9
0.109
t
(mmol/l)
(1.22 ± 0.31)
(1.13 ± 0.23)
HbA
1c
(%)
6.0 ± 1.1
6.1 ± 0.9
0.044
m
Galectin-3 (ng/ml)
17.8 ±7.3
23.9 ±7.1
0.000
t
t
:
t-
test;
m
: Mann–Whitney
U
-test; *chi-squared test (Fisher’s exact test).
SD, standard deviation; BMI, body mass index; SBP, systolic blood pressure;
DBP, diastolic blood pressure; LDL-C, low-density lipoprotein cholesterol;
hs-CRP, high-sensitivity C-reactive protein; WBC, white blood cell count;
HDL-C, high-density lipoprotein cholesterol; HbA
1c
, glycated haemoglobin.
CAE group
Control group
Galectin-3 levels (ng/ml)
50
40
30
20
10
0
Fig. 1.
Comparison of galectin-3 levels of patients with CAE
and the control group (
p
< 0.001). CAE, coronary
artery ectasia.
Table 2. Distribution frequency of CAE and Markis classification
Number
Percent
CAE
LMCA
15
30.6
LAD
32
65.3
Cx
30
61.2
RCA
26
53.1
Markis classification
Type I
16
32.7
Type II
9
18.4
Type III
6
12.2
Type IV
18
36.7
CAE, coronary artery ectasia; Cx, circumflex coronary artery; LAD, left ante-
rior descending coronary artery; LMCA, left main coronary artery; RCA, right
coronary artery.