


 42 / 64

CARDIOVASCULAR JOURNAL OF AFRICA • Volume 31, No 3, May/June 2020
150
AFRICA
Atherosclerosis typically presents itself as a narrowing of the
vessel lumen. However, post mortemand intravascular ultrasound
(IVUS) studies have demonstrated that atherosclerotic plaque
may also advance into the medial layer and external elastic
membrane (EEM) without a marked narrowing in the vessel
lumen, indicating that the vessel wall may react to atherosclerosis
in two different ways.
21
While negative remodelling results in
reduced vessel lumen diameter, positive remodelling is associated
with the propagation of plaque towards the EEM. The latter
may result in dilation without significant lumen narrowing and
obstructive CAD.
22
Formation of foam cells is directly linked to the weakened
connective tissue of the arterial wall. Macrophages secrete
elastase in response to endocytosis of modified LDL-C.
Weakening of the coronary artery, particularly caused by
protease activity, may lead to positive remodelling.
23,24
It has
been proposed that CAE may represent an exaggeration of
positive remodelling. Other studies examining the pathogenesis
of CAE have shown that endothelial injury due to atherosclerosis
may lead to degeneration in the media layer of the vessel via
activation of macrophages and inflammatory mediators such
as metalloproteins and that these structural changes may result
in segmental vessel dilation through the release of nitric oxide
and other vasodilator agents from the endothelium.
25
In a post
mortem case report by Markis
et al
.,
26
diffuse hyalinisation,
fatty accumulation, disrupted intima and media layers, focal
calcification and fibrosis, cholesterol crystals and intramural
haemorrhage were found, while CAE was not present in areas
where the media layer was grossly intact.
Gal-3 belongs to the family of soluble
β
-galactoside-binding
lectins. Although Gal-3 is primarily released by activated
macrophages, it can be also synthesised by T-lymphocytes,
endothelial cells and fibroblasts.
8,9
Gal-3 also plays a role in the
conversion of monocytes to macrophages and macrophages
to foam cells. It has been found to be expressed in foam
cells and macrophages in atherosclerotic lesions.
14,27,28
It also
enhances entry of this cell into the arterial wall, resulting in
intracellular cholesterol deposition through augmentation of
the internalisation of advanced glycation end-products and
endocytotic uptake of modified lipoproteins.
29,30
Furthermore,
Gal-3 aggravates vascular inflammation, leading to the expression
of a series of chemokines and other pro-inflammatory molecules
from macrophages.
31
In addition, an important process that contributes to plaque
instability and the progression of atherosclerotic lesions is the
phenotypic switch of VSMCs from a differentiated state to a
de-differentiated state.
In vitro
experiments have shown that
Gal-3 plays a role in the phenotypic switch of VSMCs.
32
Due
to the aforementioned mechanisms, Gal-3 is recommended as a
biomarker for the progression and imbalance of atherosclerotic
plaques.
33,34
The impact of Gal-3 on both atherosclerotic plaque formation
and destabilisation has been confirmed in several studies.
28,35,36
In
one study, MacKinnon
et al
.
16
reported that pharmacological
inhibition of Gal-3 in a well-characterised mouse model of
atherosclerosis reduced plaque development. In another study,
Tsai
et al
.
37
found a significant increase in serum Gal-3 levels
in patients with ST-segment elevation myocardial infarction
(STEMI). In addition, patients with STEMI undergoing primary
percutaneous coronary intervention had higher Gal-3 levels
compared to healthy controls, and Gal-3 levels were found to
have a predictive value for major adverse cardiac events on day
30. Furthermore, Falcone
et al
.
38
found higher serum Gal-3 levels
in patients with unstable angina pectoris compared to those with
stable angina pectoris, with a significant correlation between
Gal-3 levels and the number of diseased vessels.
In another study, type 2 diabetes mellitus patients were found
to have higher Gal-3 levels compared to type 2 diabetics without
CAD. The authors also found a significant correlation between
serum Gal-3 levels and the total number of diseased vessels
and plaques, as well as the type of calcified plaques.
39
A cross-
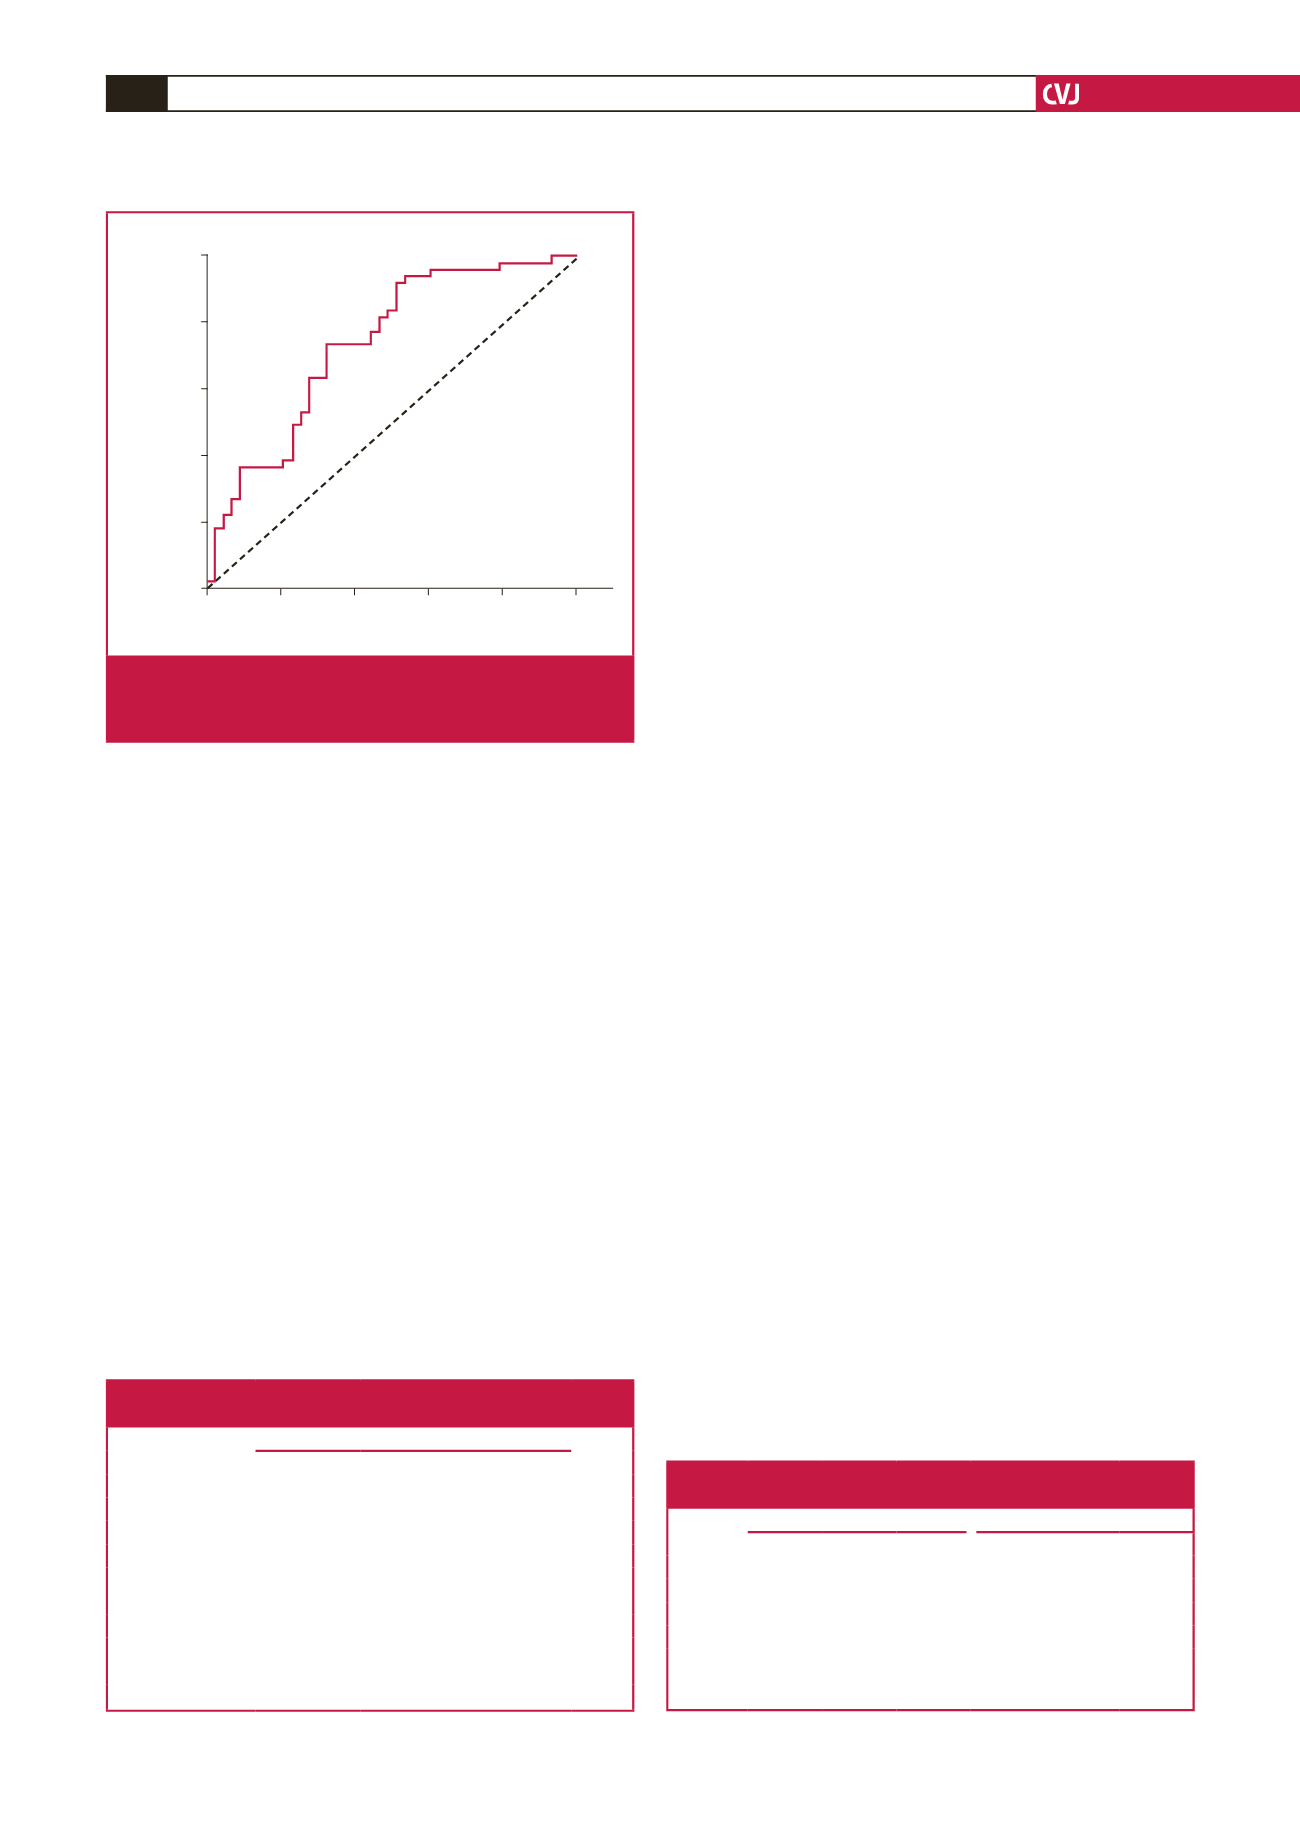
1 – Specificity
ROC curve
0
0.2
0.4
0.6
0.8
1.0
Sensitivity
1.0
0.8
0.6
0.4
0.2
0
Fig. 2.
Receiver operating characteristic (ROC) curve analy-
sis of serum galectin-3 levels in predicting CAE. CAE,
coronary artery ectasia.
Table 3. Galectin-3 levels according to the number of
affected ectatic arteries and Markis classification
Galectin-3
p-
value
Mean
±
SD Median
Min
–
Max
1-vessel disease
25.6 ± 7.3
23.9
15–42
0.093
k
2-vessel disease
25.4 ± 7.2
25.1
18–39
3-vessel disease
19.5 ± 6.4
18.2
10–34
4-vessel disease
24.3 ± 4.4
25.0
18–31
Markis classification
Type I
22.4 ± 5.5
22.7
12–34
0.418
k
Type II
25.4 ± 5.8
23.9
18–34
Type III
28.7 ± 10.5
33.3
15–39
Type IV
22.9 ± 7.3
21.8
10–42
K
Kruskal–Wallis test, SD: standard deviation.
Table 4. Variables associated with CAE according to univariate
and multivariate logistic regression analysis
Univariate model
Multivariate model
OR 95% CI
p
-value
OR 95% CI
p
-value
Ln age
1.05 1.00–1.11 0.061
Ln gender
2.18 0.94–5.02 0.069
Ln HbA
1c
a
1.13 0.74–1.74 0.566
Ln Gal-3
a
1.13 1.06–1.21 0.000
1.12 1.03–1.21 0.005
a
ORs for continuous variables are expressed in per one standard deviation
change in the natural log-transformed variables; Ln, natural log; CI, confidence
interval; OR, odds ratio; HbA
1c
, glycated haemoglobin; Gal-3, galectin-3.