


 58 / 64

CARDIOVASCULAR JOURNAL OF AFRICA • Volume 31, No 3, May/June 2020
e2
AFRICA
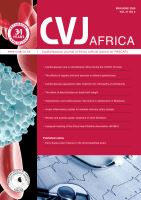
Fig. 2.
Percutaneous transluminal angiography at the initial index procedure. A shows the initial angiogram with total occlusion of
the right femoropopliteal artery (black arrows) and B depicts the well-positioned Supera stent (between black arrows) without
residual stenosis.
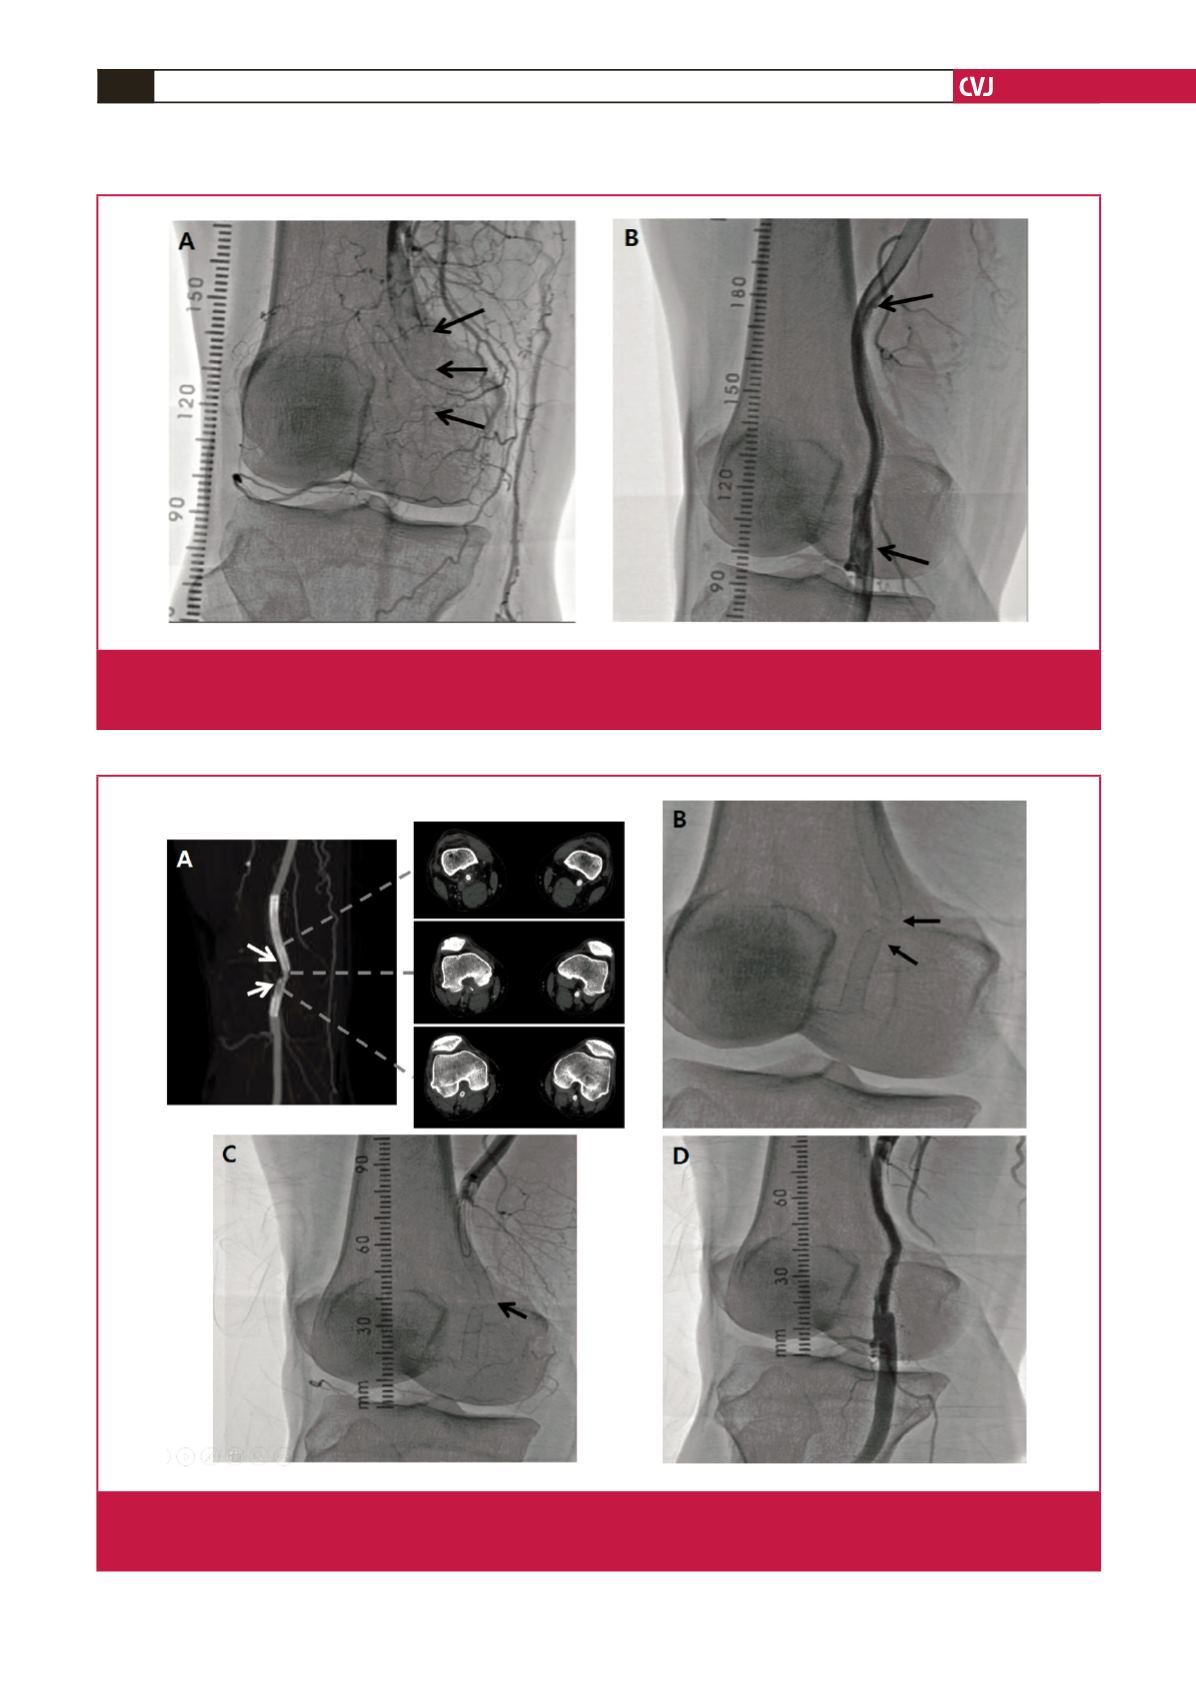
Fig. 3
Supera stent fracture. There is a definite stent fracture observed on computed tomography (A, between white arrows) and
fluoroscopy (B, between black arrows). The percutaneous transluminal angiography is performed (C, right popliteal artery is
completely occluded and black arrow demonstrates a stent fracture) and successful revascularisation is shown (D).