CARDIOVASCULAR JOURNAL OF AFRICA • Vol 21, No 1, January/February 2010
14
AFRICA
paediatric experience took the blood samples. Five millilitres of
blood was collected in a tube containing 1 mg/ml EDTA and
rapidly centrifuged. Plasma levels of total cholesterol (TC),
low-density lipoprotein (LDL) cholesterol, high-density lipo-
protein (HDL) cholesterol and triglycerides were measured and
expressed as mmol/l. According to the American criteria for a
paediatric population,
22
we defined hypercholesterolaemia as
≥
5.2 mmol/l, hypertriglyceridaemia as
>
1.14 mmol/l, hyper-LDL
cholesterol as
>
3.4 mmol/l and hypo-HDL-C as
<
0.9 mmol/l.
Statistical analysis
The Student’s
t
-test and chi-squared test were used to analyse
differences between groups in continuous and categorical vari-
ables. Tracking of lipid levels was evaluated using different
statistical methods. Spearman product-moment correlations
were calculated between the schoolchildren’s lipid levels meas-
ured at the ages of 13 to 15 and 17 to 19 years. The main effects
on the lipid levels at 17 to 19 years were evaluated using a
logistic regression model. The regression model for the school-
children’s lipid levels at 17 to 19 years included lipid levels at 13
to 15 years, change in body mass index (
∆
BMI), gender, systolic
blood pressure (SBP) and smoking. All statistical analysis was
conducted using the statistical package SPSS 9.0. Statistical
significance was set at
p
<
0.05.
Because of the young age of the target population, this inves-
tigation was undertaken with caution and with respect for the
rights and integrity of people. We asked for authorisation from
the Ministry of National Education, from teachers, the principals
of schools and the parents of the selected children. Parents were
free to refuse their child’s participation.
Results
A total of 789 children were examined at baseline in 1999.
Approximately 57.3% (452 children) were re-examined in
2003. Slightly more girls (
n
=
253) than boys (
n
=
199) were
re-examined.
Selected follow-up characteristics of the cohort study are
presented in Table 1. Significant differences between boys and
girls were found in the means of TC, HDL-C, LDL-C, diastolic
blood pressure (DBP) and
∆
BMI values, and amount of smok-
ing, hyperglycaemia and sedentary lifestyle.
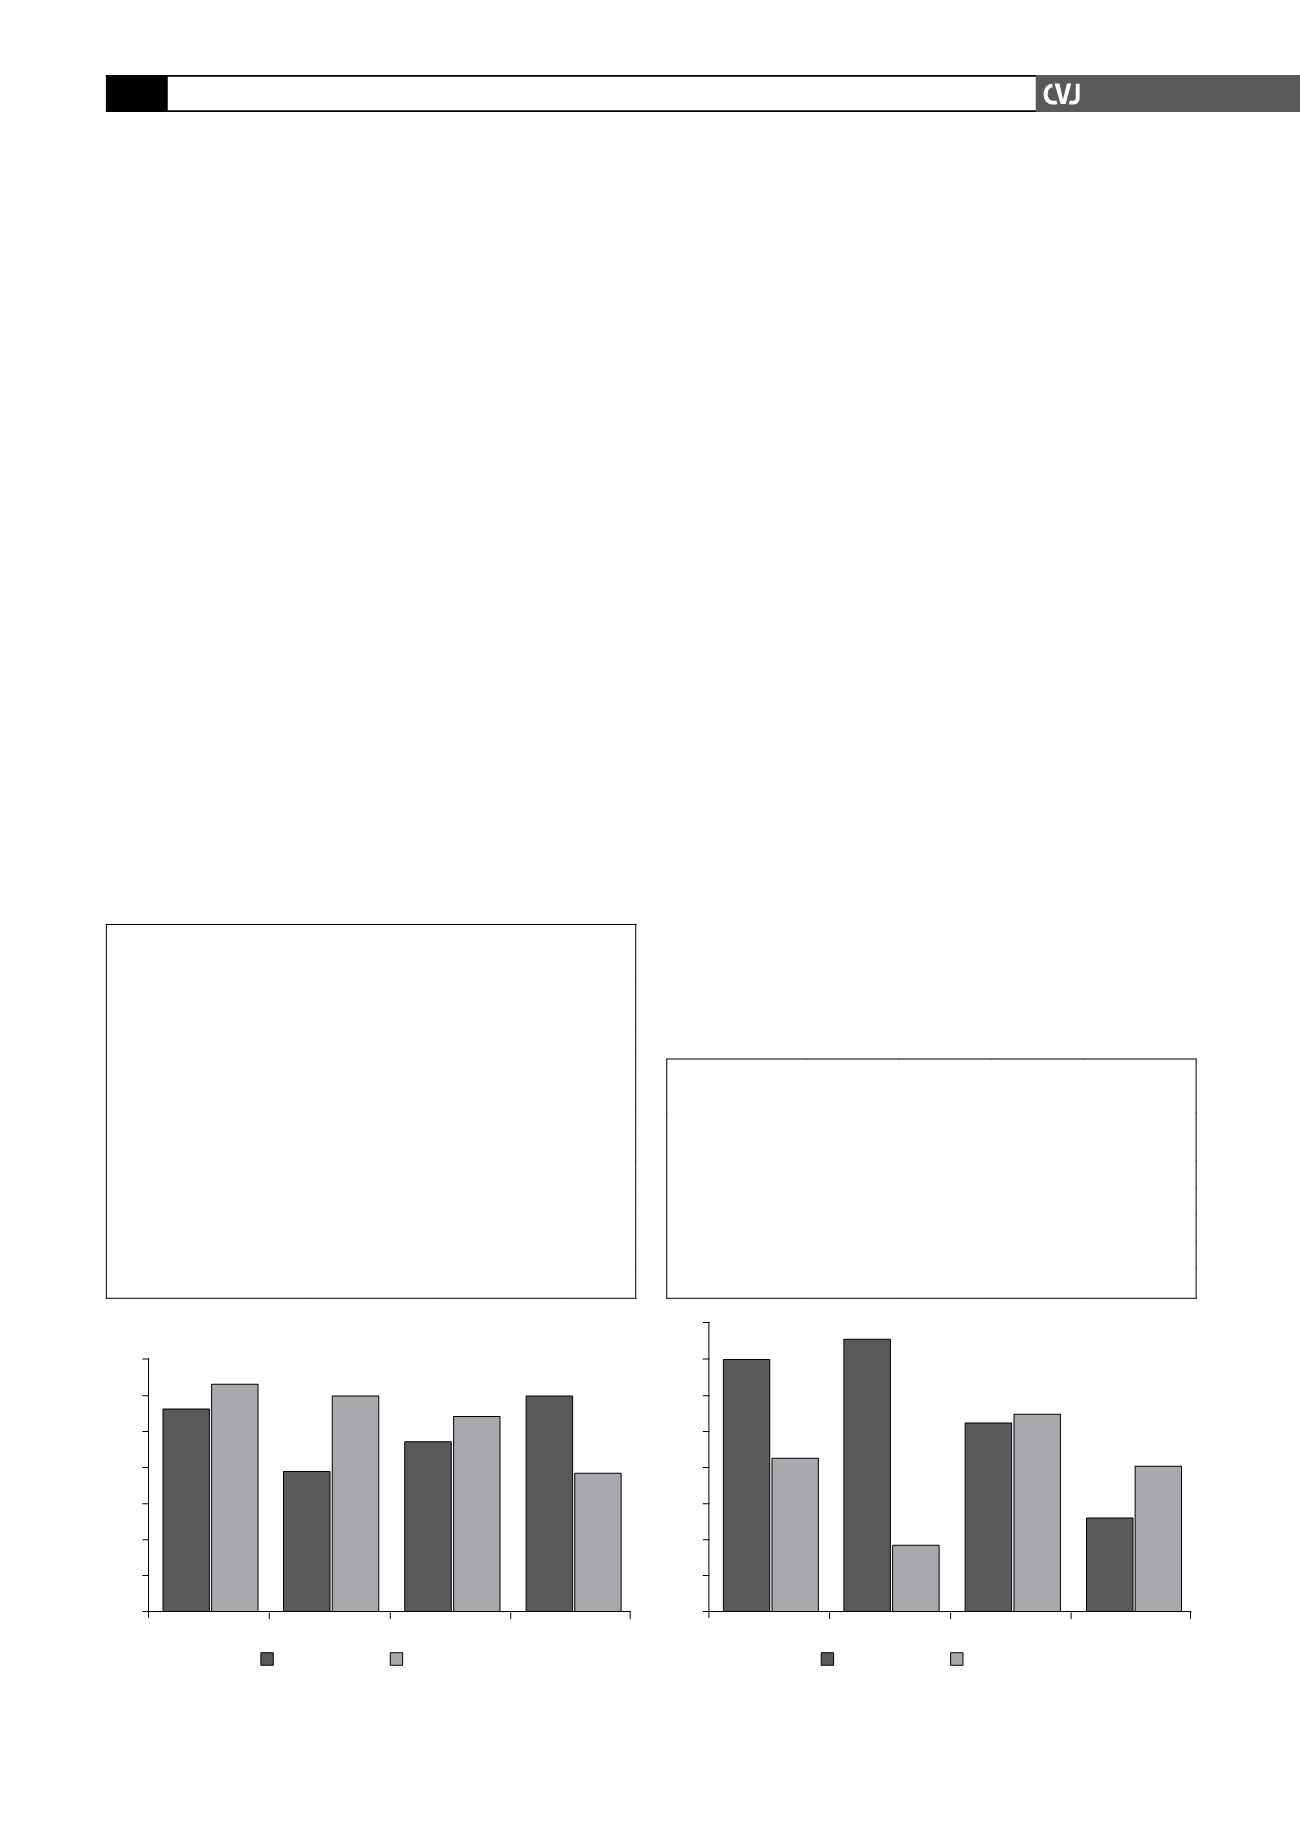
Figs 1 and 2 show the proportion of children in the highest
and lowest gender-specific quartiles in 2003. The proportion of
boys initially in the extreme quartile for TC, LDL cholesterol
and trigliceride levels was 42.5, 54.8 and 40.4%, respectively.
Similarly, for girls in the extreme quartile it was 62.7, 53.8 and
38.2%, respectively. Four years later, both the boys and girls were
still in the extreme quartile for these parameters. The percent-
age of boys versus girls in the first quartile for HDL cholesterol
values was 75.8 and 38.5%, respectively (
p
<
0.001).
Another measure of tracking is the correlation of serum lipid
and lipoprotein levels taken at two time points. In Table 2 the
correlation coefficients are shown for these parameters measured
four years apart. All correlation coefficients were statistically
significant at the
p
=
0.001 level. The independent variables
included the baseline (1999) lipid level,
Δ
BMI, sedentary life-
style, smoking status, glycaemia
>
6.2 mmol/l, SBP and DBP.
The best predictor of follow-up level for each of the serum
lipoprotein cholesterol fractions was the corresponding baseline
TABLE 1. FOLLOW-UP PARAMETERS OF THE STUDY
POPULATIONACCORDINGTO GENDER
Boys
(n
=
199)
Girls
(n
=
253)
p
Mean of total cholesterol
4.05
±
0.70 4.29
±
0.78 0.001
Mean of triglycerides
0.92
±
0.33 0.94
±
0.41 0.664
Mean of HDL-C
1.57
±
0.31 1.63
±
0.28 0.028
Mean of LD-C
2.05
±
0.58 2.22
±
0.66 0.050
Mean of SBP
121.34
±
19.00 121.10
±
11.32 0.873
Mean of DBP
68.82
±
11.05 72.12
±
9.42 0.001
Mean of
∆
BMI
2.89
±
2.37 1.57
±
2.14
<
10
-3
% smoking
5.5
0.4
0.001
% hyperglycaemia
4
0.8
0.021
% sedentarity
4
4.7
0.711
TABLE 2. CORRELATION MATRICES OF THE LIPID
PARAMETERS BETWEEN 1999 AND 2003
Total
cholesterol HDL-C LDL-C Triglycerides
Total cholesterol 0.604*** 0.287*** 0.512*** 0.122*
HDL-C
0.233*** 0.601*** 0.024
–0.161**
LDL-C
0.571*** 0.096* 0.571*** 0.114
Triglycerides
0.096* –0.133* 0.094
0.377***
***
p
<
10
-3
; **
p
<
0.0011; *
p
<
0.00.
Fig. 1. Tracking of serum lipid levels in adolescent girls
between 1999 and 2003.
70
60
50
40
30
20
10
0
First quartile Fourth quartile
Total chol
HDL-chol
LDL-chol
Triglicerides
Fig. 2. Tracking of serum lipid levels in adolescent boys
between 1999 and 2003.
80
70
60
50
40
30
20
10
0
First quartile Fourth quartile
Total chol
HDL-chol
LDL-chol
Triglicerides


