CARDIOVASCULAR JOURNAL OF AFRICA • Volume 25, No 1, January/February 2014
AFRICA
23
where the distribution is more symmetrical with fewer outliers.
It seems safe to assume that these groups were not comparable
in term of pre-operative severity or risk factors (the average age
confirms this to an extent). This is also likely to be the case as
TAVI is typically indicated only for inoperable and so-called
‘high-risk’ patients diagnosed with symptomatic severe aortic
stenosis. However, cAVR is typically only avoided in patients
where the operative risk is considered too high in comparison
with the benefits gained, or in those patients determined as
inoperable for anatomical reasons.
Comparing the cost distributions, we see that the upper 21st
percentile of the cAVR sample equals the same average costs
as the entire TAVI group, that is, the most costly 50 patients
undergoing cAVR generated the same average costs as the 75
TAVI patients (Fig. 2). We could then state that on average, one
patient out of five could be treated with a less-invasive therapy
associated with lower in-hospital mortality and faster recovery
at an equal cost.
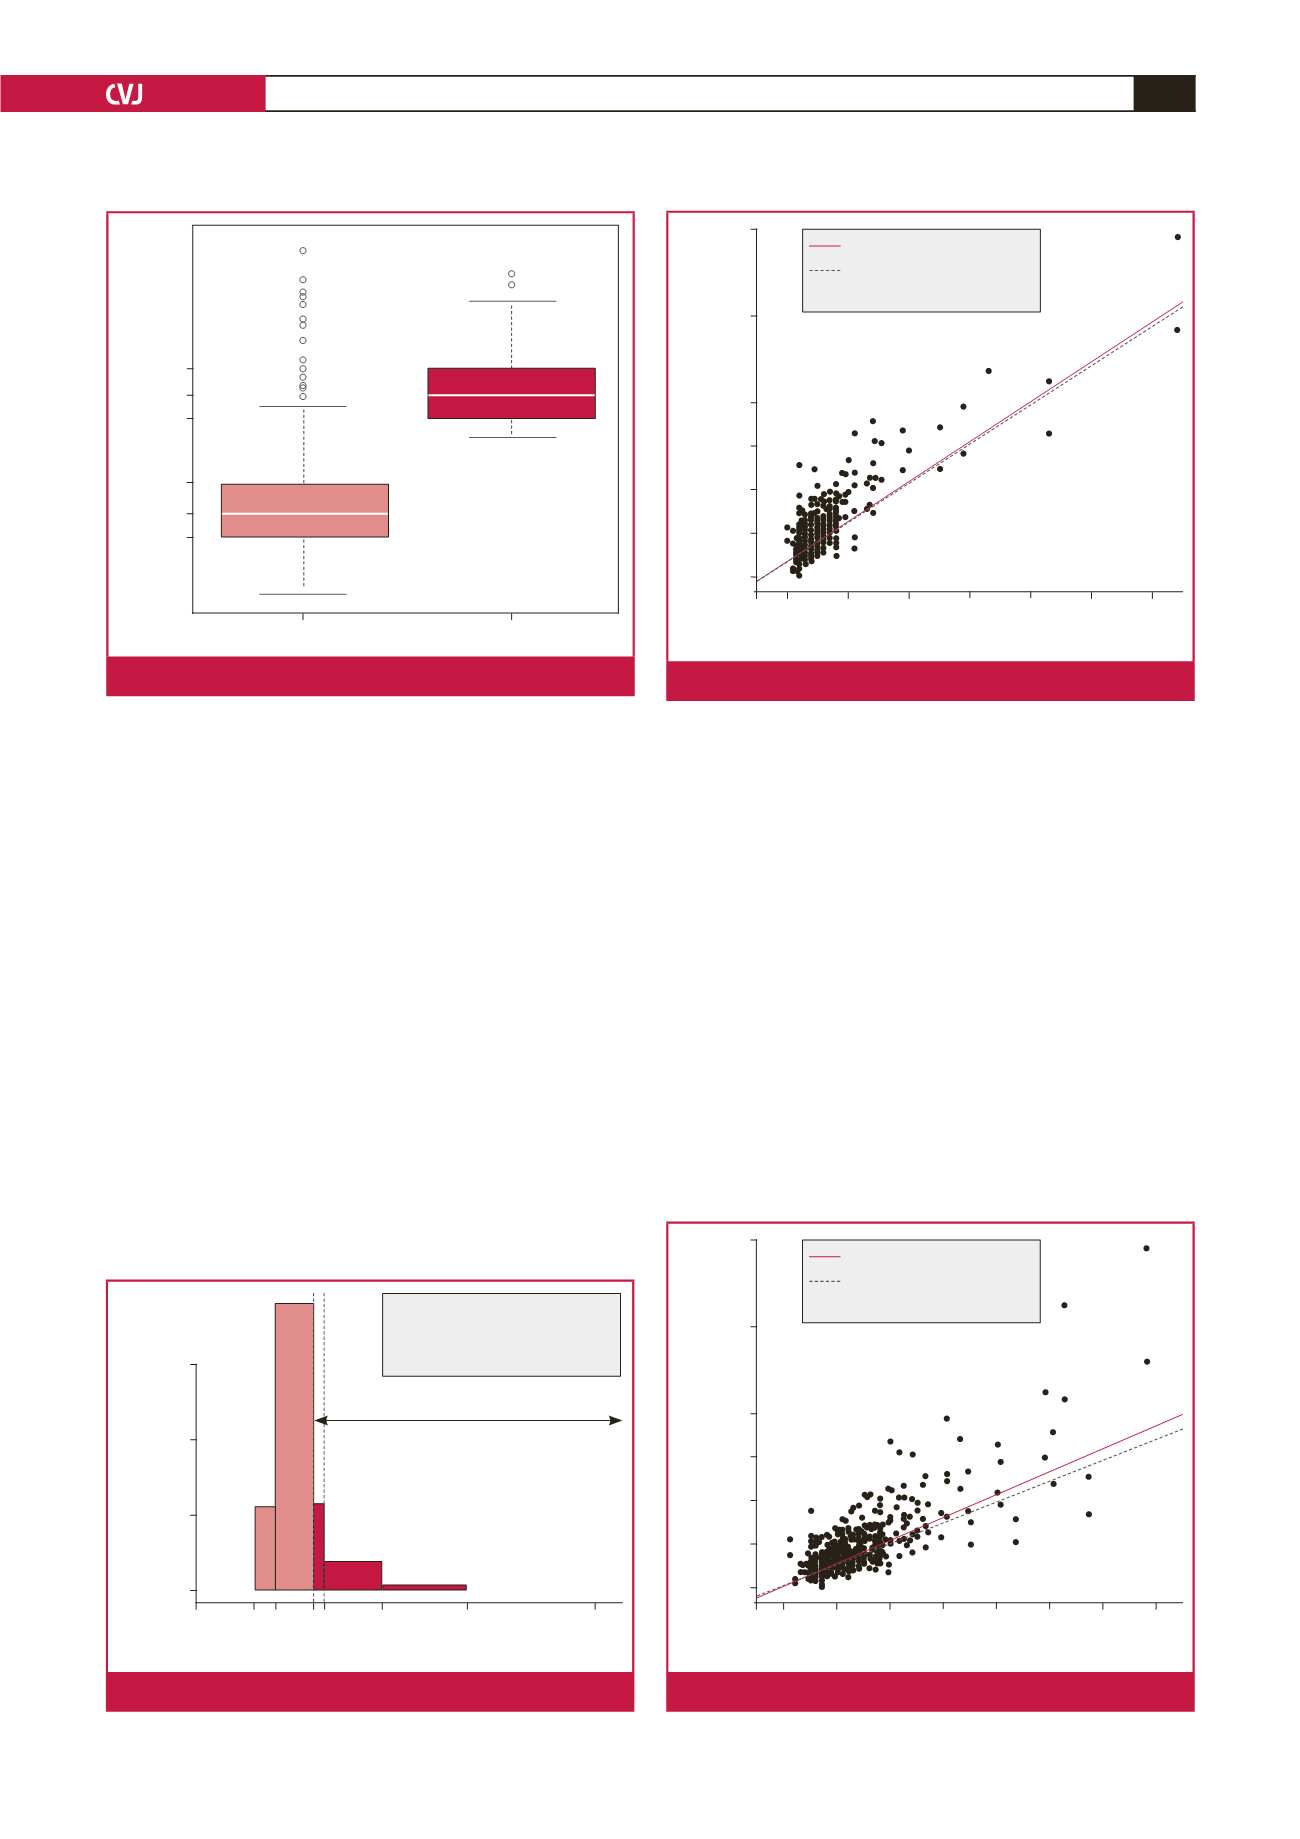
In our sample, ICU and hospital LoS were also heavily
positively correlated with cost and highly statistically significant
in both cases (
p
<
0.001). Figs 3 and 4 illustrate the linear
relationship with linear regression models fitted. Each additional
ICU and hospital day increased the total costs by ZAR 12.6k
(0.44) and ZAR 7.9k (0.34), respectively.
By contrast, age and gender, our only two pre-operative
variables available, were not predictors of cost. The linear
correlation between age and total costs was statistically
significant (
p
<
0.001) but the coefficient, also positive, was low
in comparison with the previous one of 0.226 (Fig. 5). The total
cost distributions were similar for both sexes (Fig. 6).
Stratifying patient groups
In order to make a comparison of costs between procedures, we
attempted to use the available data to select those cAVR patients
most likely to have also been eligible for a TAVI (assuming
typical selection criteria). Although we had very few predictive
risk factors, we examined the literature for data on LoS to use as
proxies for defining a more ‘high-risk’ subgroup of cAVR patients.
357k
327k
300k
229k
194k
167k
Isolated cAVR (
n
= 239)
TAVI (
n
= 75)
Total costs (ZAR)
Fig. 1.
Distribution of total costs for TAVI and cAVR.
0.006
0.004
0.002
0.000
100k
Cost of AVR (ZAR)
Density
239k 400k 600k
900k
n
: 239
Mean (sd): 213.9 (87.4)
Median [IQ]: 193.6 [166.5–228.6]
Range: 103.8–879.6
Mean of 21st upper percentile = mean TAVI
Fig. 2.
Total cost distribution for cAVR.
900k
700k
500k
400k
300k
200k
100k
0 10 20 30 40 50 60
ICU LoS (days)
Total costs (ZAR)
Slope OLS = 12.6
Slope robust = 12.4
Linear correlation = 0.879
Fig. 3.
Correlation of ICU LoS with total costs of cAVR.
900k
700k
500k
400k
300k
200k
100k
0 10 20 30 40 50 60 70
Hospital LoS (days)
Total costs (ZAR)
Slope OLS = 7.89
Slope robust = 7.08
Linear correlation = 0.83
Fig. 4.
Correlation of hospital LoS with total costs of cAVR.


