CARDIOVASCULAR JOURNAL OF AFRICA • Volume 25, No 1, January/February 2014
24
AFRICA
As a baseline for LoS with both TAVI and cAVR we have
data from cohort A of the Partner trial,
7,8,15
which gives values for
ICU and hospital LoS. The means (medians) for the high-risk
cAVR patients were 8.4 (5.0) ICU days and 16.7 (12.0) hospital
days. Additionally, Thourani
16
described the outcomes in surgical
cohorts undergoing AVR who would meet the qualifications for
transcatheter valve therapies and was able to retrieve data on
159 patients from January 2002 to December 2007 at four US
academic institutions. Here the mean ICU and hospital LoS were
6.9
±
10.6 and 12.6
±
11.1 days, respectively; very similar to the
Partner trial results. In a study from Switzerland, Wenaweser
17
determined that a group of cAVR patients, who were younger and
had lower predicted peri-operative risks (logistic EuroSCORE
12.5
±
8.2%) compared with two other groups (TAVI or medical
management), had a mean hospital LoS of 15.0
±
20.2 days.
The French Ministry of Health (MoH) records all procedures
in the administrative PMSI database. The database is mandatory
for each centre in order to be reimbursed. With the corresponding
DRGs and specific procedure codes, we were able to select and
retreive basic information from all isolated cardiac surgery
procedures in France in 2010. This analysis gave us a real-life
picture of the French cardiac surgery environment. Clinical data
were limited, as was to be expected, but in-hospital mortality,
hospital LoS and procedure costs were available.
Specific risk scores, such as the logistic EuroSCORE or the
STS score were not available, but we were able to populate the
Charlson score, an administrative score calculated from the ICD
codes. This score has been validated in different publications
18,19
and is used as a risk factor in various areas such as oncology,
20
acute myocardial infarction,
21
ischaemic stroke
22
and infection.
23
By using the score we gained an idea of the average pre-operative
risk score for each of the four severity levels derived post
surgery, leading to a specific reimbursement DRG. In the
France 2 TAVI registry, including all TAVI procedures between
2010 and 2011,
24
the Charlson score was calculated for 2 568
patients (unpublished data) in an intermediate report sent to the
HAS (Haute Autorité de Santé or French National Authority for
Health) to evaluate the technology, and the sample mean was 2.6
±
2.2 (median
=
2.0).
Table 2 illustrates the strong correlation between the Charlson
score, in-hospital mortality, hospital LoS, procedure costs and
severity level defined postoperatively. From this table, it seems
reasonable to assume that the majority of TAVI candidates would
have been severity level 3 and 4. Therefore we could assume
that around 15% of the entire cAVR population could have
been considered high risk and would fit the TAVI indications.
For these patients the ‘real-life’ clinical outcomes were far
from what can be found in the literature, with average hospital
LoS above 20 days and the in-hospital mortality rate up to
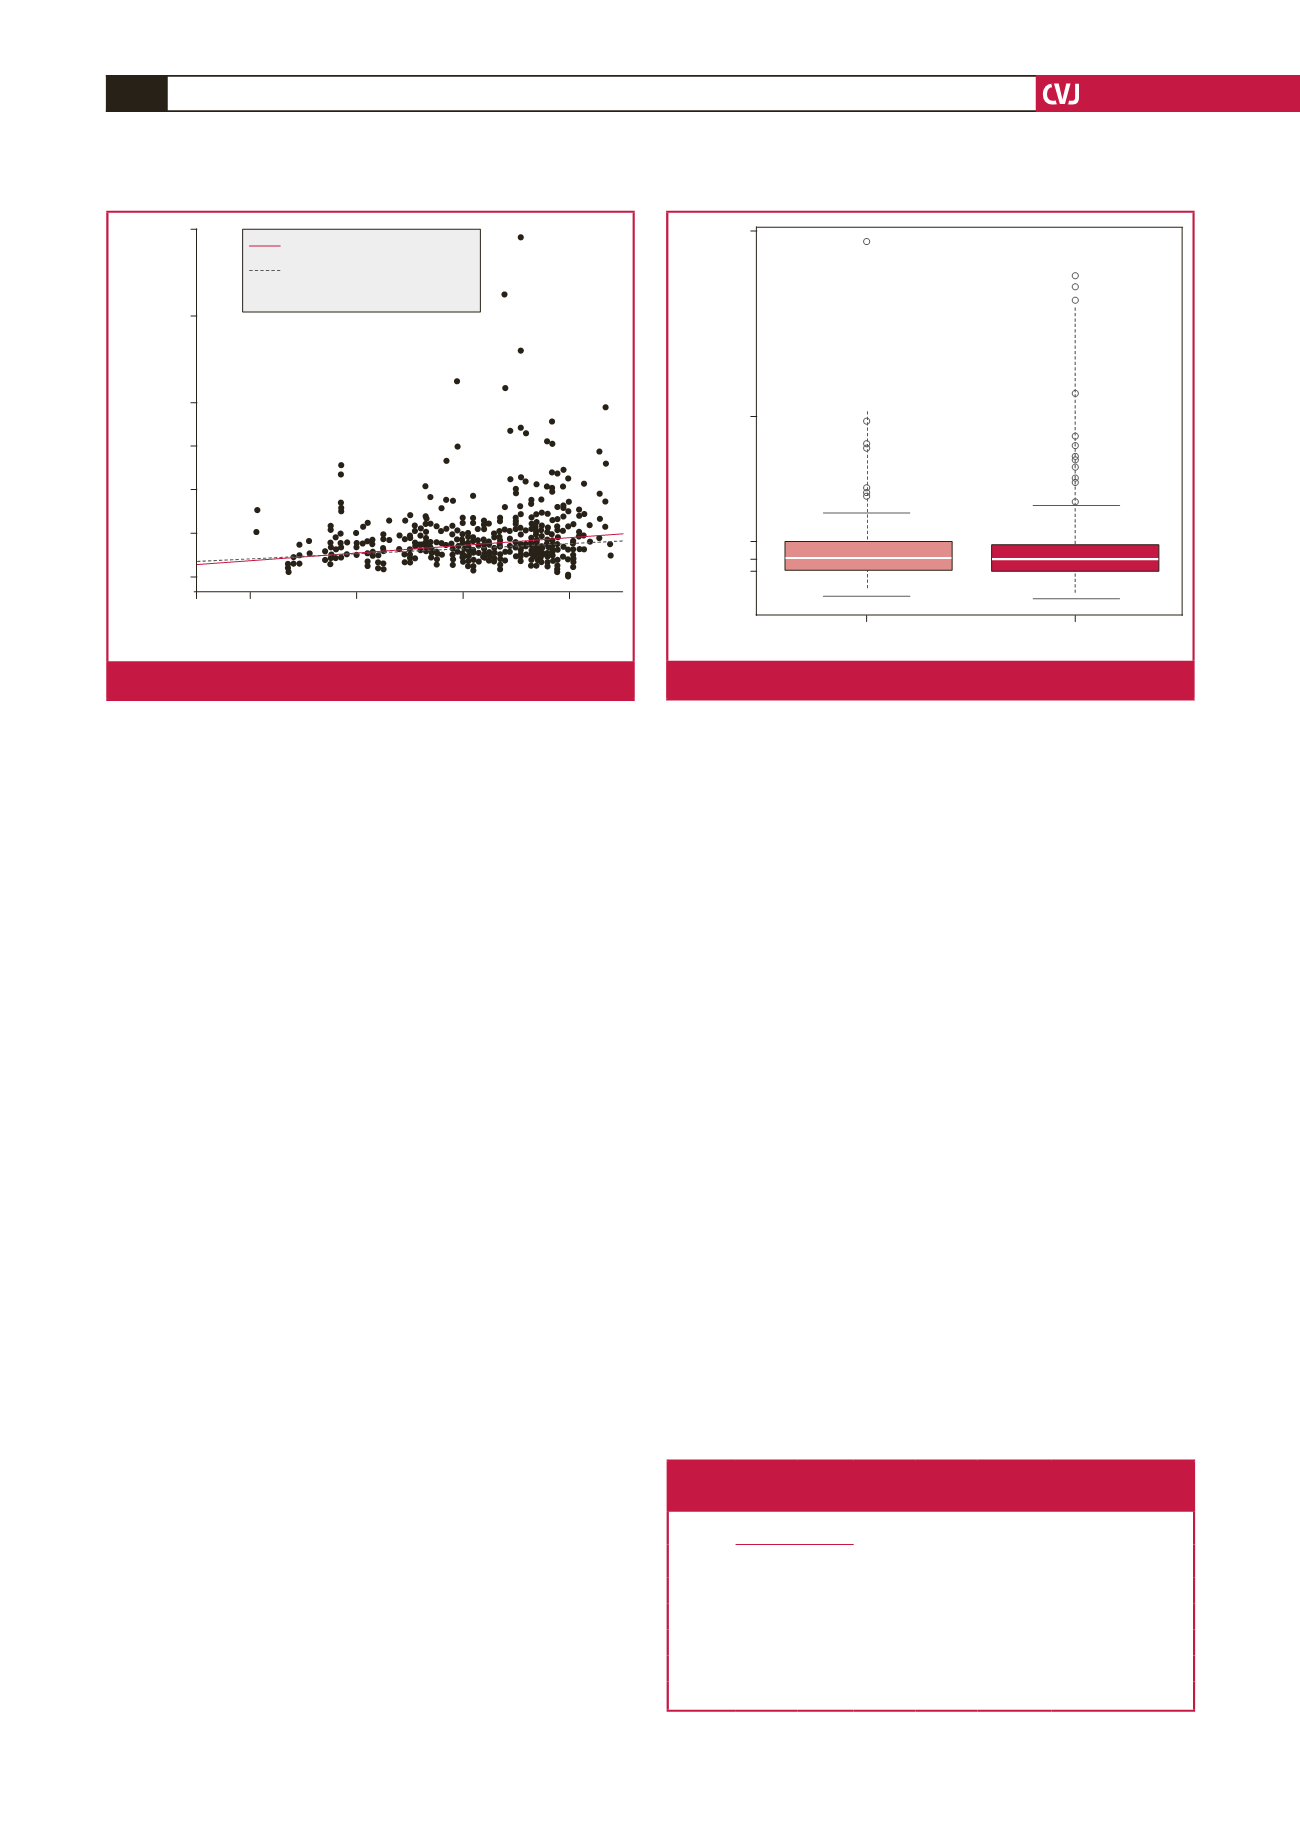
20%. Surprisingly, age did not seem to have a strong impact on
hospital LoS, in-hospital mortality rate or procedure costs.
To produce the most conservative estimate of the cAVR
group comparable with TAVI, if we take our sample with the
proxy thresholds defined above, i.e. ICU and hospital LoS above
six and 13 days, respectively, patients
≥
75 years, we derive
our subset of high-risk patients. Table 3 shows the number of
patients, in-hospital mortality rate and average costs for each
criterion considered.
When combining all three parameters, 14 patients (5.9%)
were found, which is not surprising, as we could expect that
some of these patients were treated with TAVI. The average costs
estimate for our high-risk patients was ZAR 337.9k
±
80.9k,
marginally higher than the average TAVI costs (ZAR 335.5k).
However, very strikingly, the clinical outcome was much worse,
with an in-hospital mortality rate of 21.4%, more than four times
that of TAVI [RR
=
0.25 (0.06–0.99),
p
=
0.075].
Table 2. Cardiac surgery (cavr) from the French
moh database
Severity
Patients
Age
(years)
Charl-
son
Hospital
mortal-
ity (%)
Hospital
LoS
(days)
Total
costs
(ZAR)
n
%
Level 1 2 537 20.3 69.2 1.02 1.66
10.7 14 365
Level 2 5 805 46.4 73.0 1.74 2.48
12.5 16 304
Level 3 2 733 21.8 73.6 2.47 8.89
16.8 22 196
Level 4 1 437 11.5 71.9 2.84 21.85 27.9 32 250
Total
12 512 100.0 72.3 1.88 5.94
14.8 19 029
900k
700k
500k
400k
300k
200k
100k
20
40
60
80
Age
Total costs (ZAR)
Slope OLS = 1.31
Slope robust = 0.931
Linear correlation = 0.226
Fig. 5.
Correlation of age with total costs of cAVR.
900k
500k
230k
192k
166k
Female (
n
= 96)
Male (
n
= 143)
p
-value = 0.696
Total costs (ZAR)
Fig. 6.
Total costs of cAVR by gender.


