


 33 / 76

CARDIOVASCULAR JOURNAL OF AFRICA • Volume 27, No 6, November/December 2016
AFRICA
363
patients were on antidiabetic, non-steroidal anti-inflammatory
and antiplatelet drugs, respectively. A sizeable proportion
of treated patients (42%) self-reported non-compliance with
antihypertensive therapy.
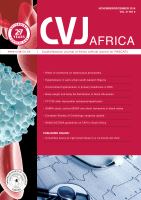
Uncontrolled hypertension was observed in 231 patients
(77.5%), 72 men and 159 women, of whom 43, 24 and 5%
had uncontrolled SBP and DBP, isolated uncontrolled SBP
and isolated uncontrolled DBP, respectively (Table 1). The
frequency of uncontrolled SBP and DBP was significantly
higher in patients with reduced eGFR (62.5 vs 43.2%;
p
=
0.01)
in comparison with those with relatively normal renal function
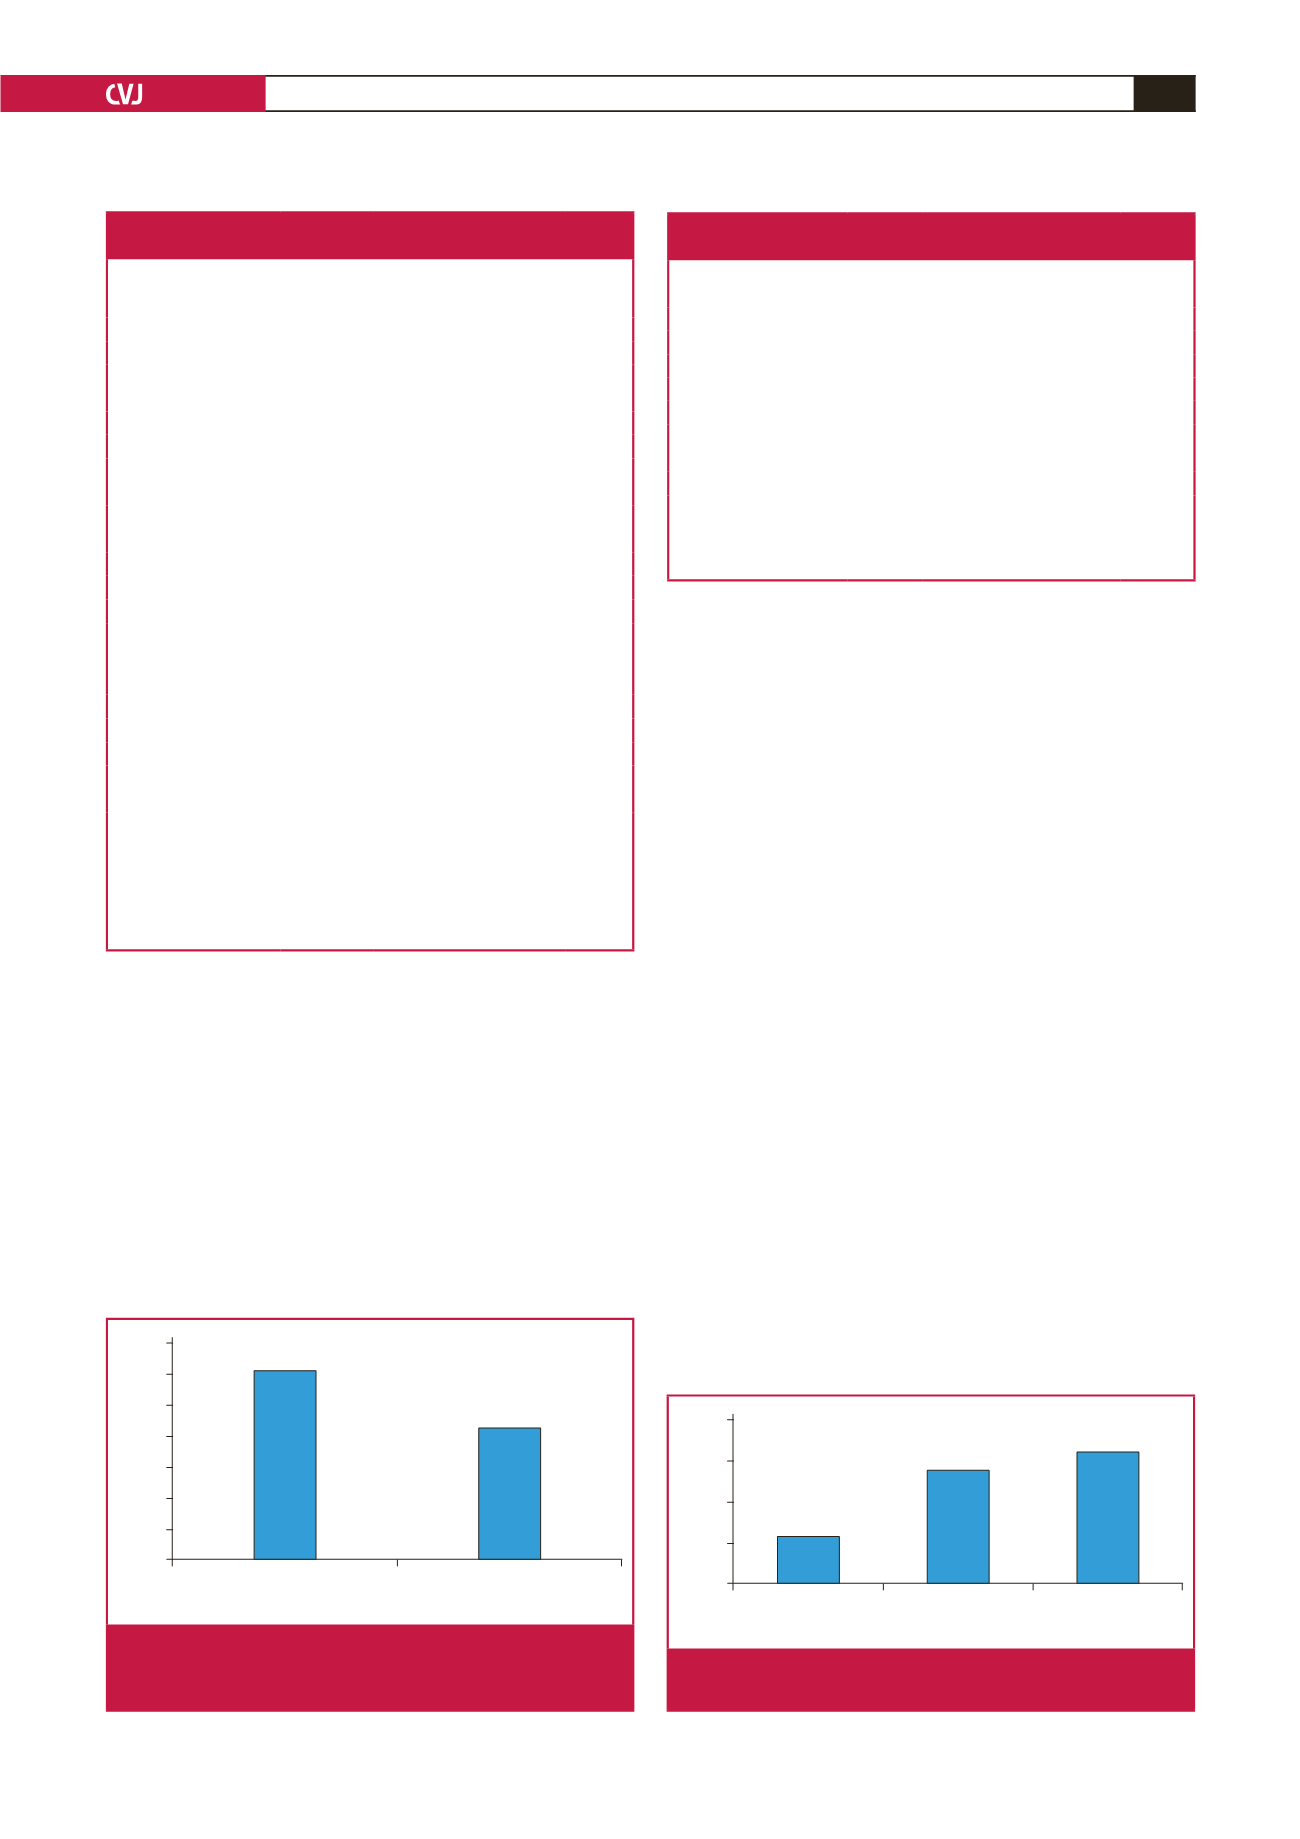
(Fig. 1). Uncontrolled SBP increased significantly (
p
=
0.002)
with advancing age (Fig. 2).
Compared to patients with controlled hypertension (Table
3), those with uncontrolled BP had significantly higher levels
of blood glucose (119
±
14 vs 104
±
27 mg/dl;
p
=
0.011); there
were also higher numbers of subjects with diabetes (42 vs 22%;
p
=
0.003), lower high-density lipoprotein cholesterol levels
(HDL-C) (24 vs 13%;
p
=
0.034), and moderate (45 vs 18%;
p
=
0.006) and high to very high (38 vs 13%;
p
=
0.02) global CV risk
(Table 4). In patients with uncontrolled hypertension, a higher
proportion was not compliant with the antihypertensive therapy;
but the difference did not reach the level of statistical significance
(Table 1).
In multivariate analysis, the metabolic syndrome (MetS)
and non-compliance with antihypertensive therapy emerged
as the main risk factors for uncontrolled hypertension (Table
5). Compared to patients without the MetS, those bearing this
metabolic abnormality had a 2.4-fold greater risk (OR 2.4; 95%
CI 1.008–5.735;
p
=
0.04) of having uncontrolled hypertension.
Patients not compliant with antihypertensive therapy had a 2.14-
fold greater risk (OR 2.14; 95% CI 0.986–4.236;
p
=
0.05) of
uncontrolled hypertension in comparison with those compliant
with therapy; but the difference was not statistically significant.
Discussion
The main findings of this cross-sectional study were as follows:
first, uncontrolled hypertension with mainly uncontrolled
SBP was frequent in these case series; second, the frequency
of uncontrolled hypertension and that of uncontrolled SBP
Syst-Diast HT, %
<
60
≥
60
eGFR (ml/min/1.73 m
2
)
70
60
50
40
30
20
10
0
62.5
43.2
Fig. 1.
Frequency of uncontrolled systolic and diastolic hyper-
tension (Syst-Diast HT) by renal function status (
n
=
231).
Syst HT, %
<
60
60–69
≥
70
Age (years)
40
30
20
10
0
11.3
32.1
27.8
Fig. 2.
Frequency of uncontrolled systolic hypertension (Syst
HT) by age category (
n
=
231).
Table 1. Clinical characteristics of the study population as a whole and
by blood pressure control status
Variable
Whole group
(
n
=
298)
Controlled
HT
(
n
=
67)
Uncontrolled
HT
(
n
=
231)
p
-value
Age, years
64
±
10
64
±
10
64
±
10
Gender, %
Males
30
27
31
0.548
Females
70
73
69
DHT, %
0.179
<
1 year
15
16
14
1–4 years
29
39
26
5–9 years
23
19
24
≥
10 years
33
26
35
FH-HT, %
50
49
50
0.851
FH-DM, %
31
22
34
0.166
BMI, kg/m²
26
±
5
26
±
5
25
±
5
0.238
WC, cm
90
±
11
90
±
11
90
±
11
0.953
SBP, mmHg
151
±
24
122
±
10
160
±
20
0.001
DBP, mmHg
87
±
14
75
±
7
91
±
13
0.001
MBP, mmHg
109
±
16
91
±
7
114
±
13
0.001
PP, mmHg
64
±
19
47
±
9
69
±
18
0.001
Pulse rate, bpm
76
±
13
77
±
12
77
±
13
0.493
AntiHT regimen, %
1 drug
66
75
66
0.171
≥
2 drugs
34
25
34
Non-drug compliance, % 42
42
42
0.050
Data are expressed as mean
±
standard deviation (SD) or relative frequency (%).
DHT, duration of hypertension; FH-HT, family history of hypertension;
FH-DM, family history of diabetes mellitus; BMI, body mass index; WC, waist
circumference; SBP, systolic blood pressure; DBP, diastolic blood pressure;
MBP, mean blood pressure; PP, pulse pressure; bpm, beats per minute; AntiHT,
antihypertensive.
Table 2. Antihypertensive and non-antihypertensive
drugs in the study population
Antihypertensive drugs
(
n
=
298) Non-antihypertensive drugs (
n
=
298)
Monotherapy, %
66
Lipid-lowering drugs, % 0.3
Diuretic, %
43
Uric acid-lowering drugs, % 0
CCB, %
11
Antiplatelet drugs, % 6
ACEI, %
11
NSAIDs, %
9
CAA, %
1
Antidiabetic drugs,
29
Combined therapy, %
34
Diuretic
+
ACEI, %
17
Diuretic
+
CCB, %
9
ACEI
+
CCB, %
4
Others, %
4
Data are expressed as relative frequency (in percent).
CCB, calcium channel blocker; ACEI, angiotensin converting enzyme inhibitor;
CAA, central-acting agents; NSAID, non-steroidal anti-inflammatory drugs.