


 39 / 76

CARDIOVASCULAR JOURNAL OF AFRICA • Volume 27, No 6, November/December 2016
AFRICA
369
(
p
<
0.001), access to flush toilets and running water inside the
house (
p
<
0.001), and an increase in the number of participants
who were employed (
p
<
0.05). At baseline, 58% of the women
had at least one child, and this increased to 86% at follow up
(
p
=
0.001). During the follow-up period, 24 (38%) women had
one child, and three women (5%) had two children. Hormonal
contraceptive use did not change significantly over time. The
proportion of women who smoked increased over the follow-up
period, but the proportion of women who consumed alcohol did
not change significantly.
At baseline, the median moderate- to vigorous-intensity
physical activity of the women was 60 min/day, with 70% of
women using walking as a mode of travel. At baseline, the
majority of dietary energy (kcal) was derived from carbohydrates
(52.2%), followed by fat (34.8%) and protein (12.4%). The
median total DQI-I score was 54 (IQR: 47–60), with a median
(IQR) variety score of 17 (15–20), adequacy score of 25 (20–32),
moderation score of 6 (3–12) and balance score of 3 (2–4). None
of the baseline physical activity or dietary factors contributed
significantly to weight change during the follow-up period so
were not included in any further statistical analyses.
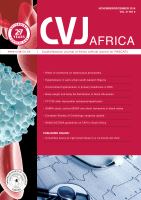
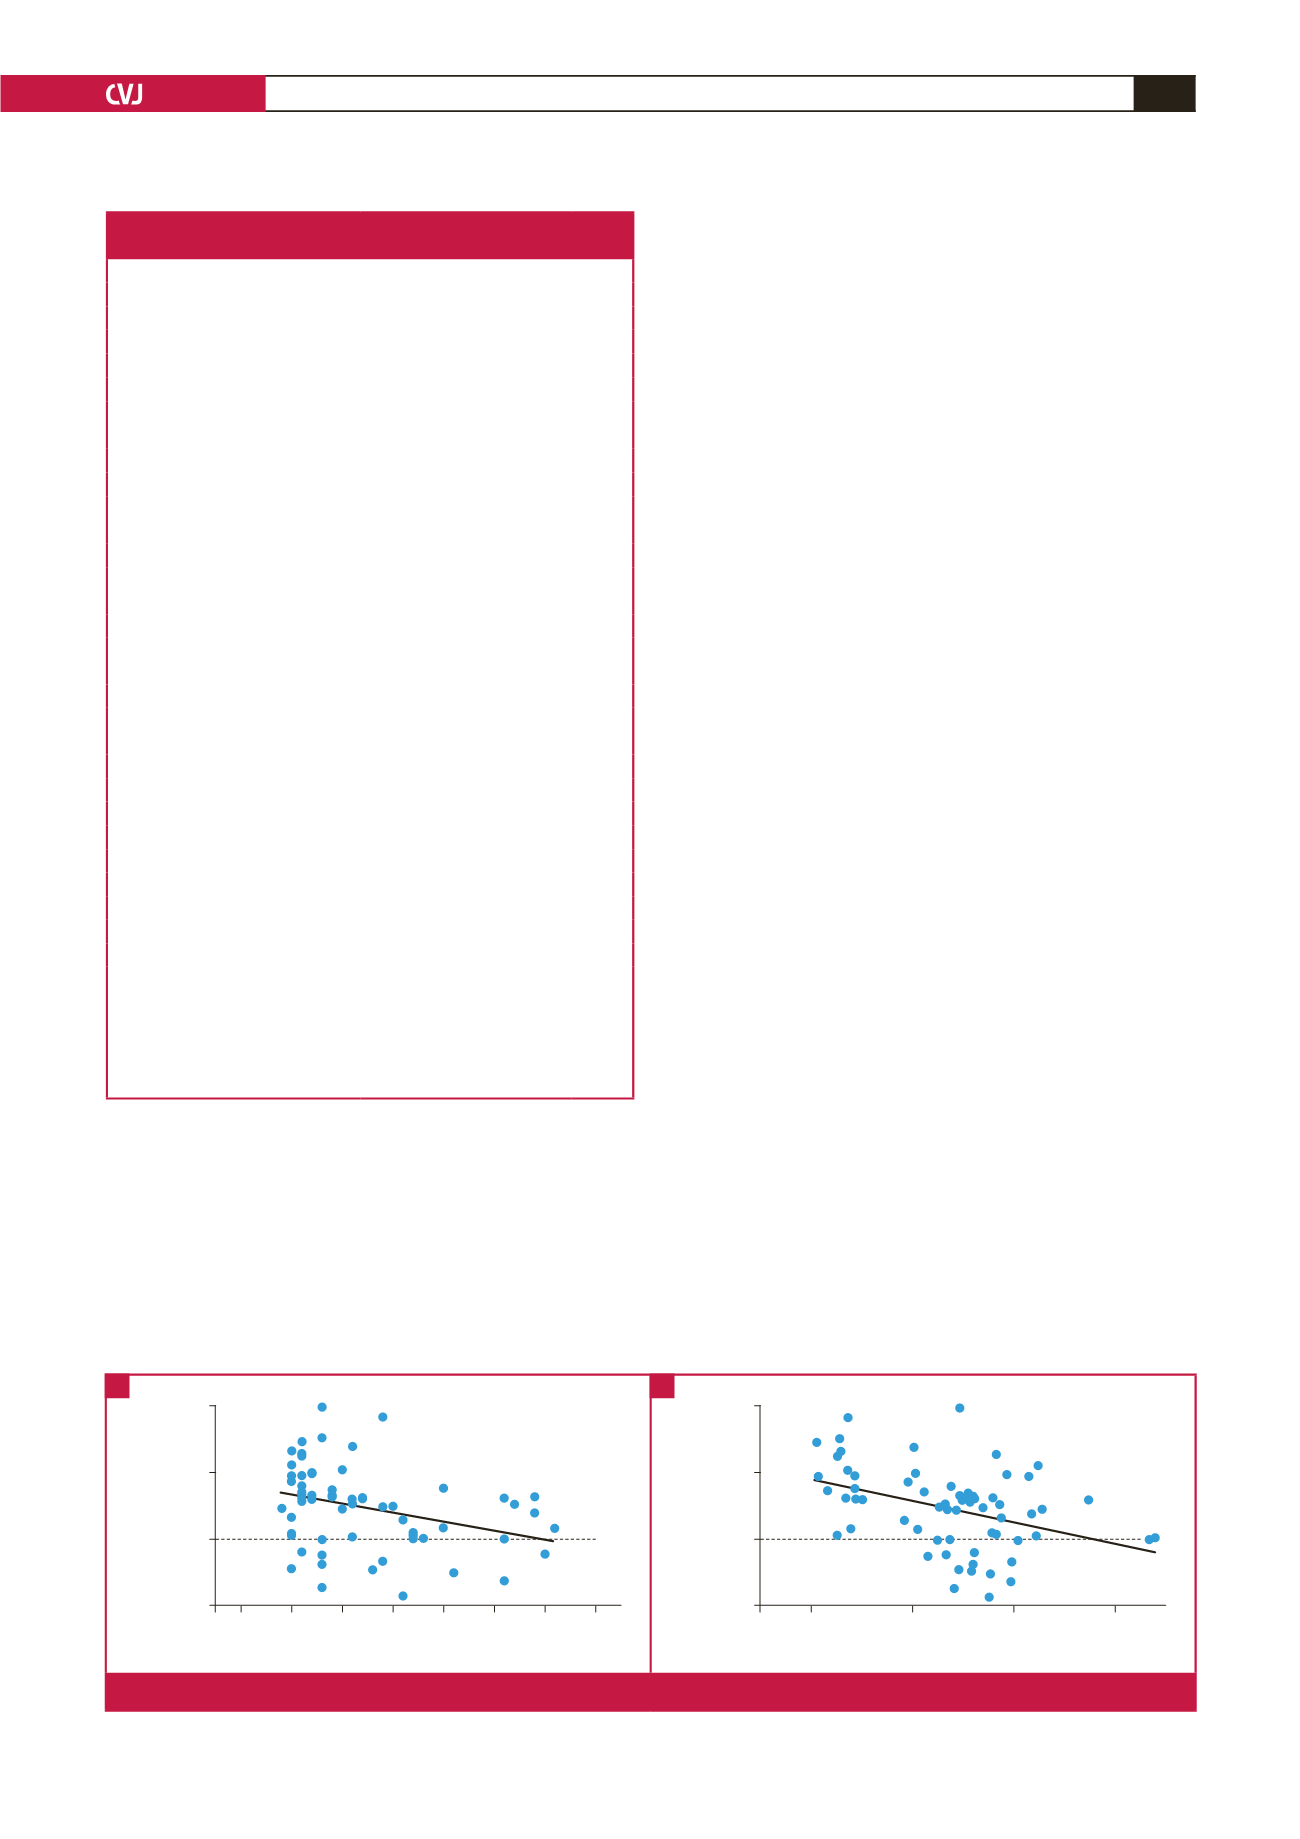
Although there was no association between age and BMI
at baseline, both were inversly associated with change in body
weight (Fig. 1A, B). To further investigate the effect of baseline
age on changes in body composition, participants were divided
into two categories, those above and those below the median age
of 25 years (Fig. 2). The younger participants (
<
25 years) gained
significantly more body weight, total fat mass, appendicular fat
mass, and trunk fat mass than the older participants (
≥
25 years)
(
p
<
0.05), with a three-fold greater increase in fat mass in the
younger compared to the older group (6.3
±
6.9 vs 2.1
±
6.5 kg,
p
=
0.016). The increase in fat mass in the younger versus the older
group occurred mainly in the central (trunk) region (3.9
±
3.7 vs
1.2
±
3.4 kg,
p
=
0.005) rather than the appendicular region (2.4
±
3.4 vs 0.8
±
3.2 kg,
p
=
0.066).
To further explore the effect of baseline BMI on changes in
body composition, the participants were separated into three
BMI categories, non-obese (NO: BMI
<
30 kg/m
2
,
n
=
17), obese
class 1 (OBc1: BMI: 30–34.9 kg/m
2
,
n
=
17) and obese class 2
(OBc2: BMI
≥
35 kg/m
2
,
n
=
35). The annual average weight gain
was 1.8
±
0.9, 1.2
±
2.1 and 0.9
±
1.9 kg in the NO, OBc1 and
OBc2 groups, respectively.
Absolute and percentage changes in body composition over
the 5.5-year follow-up period in the three BMI groups are
presented in Table 2. There was no significant difference in age
between the BMI groups (NO: 24.7
±
1.8 vs OBc1: 28.7
±
1.8 vs
OBc2: 27.2
±
1.3 years,
p
=
0.283). While the absolute changes (kg)
in the various body composition variables were not significantly
different between the groups, the percentage changes in body
composition (relative to baseline) were significantly greater in
the NO group compared to the other two groups. In addition,
when expressed as a percentage of total fat mass, there were
significant group
×
time interaction effects for the changes in
Table 1. Socio-economic and lifestyle variables at baseline
and after 5.5 years of follow up
Indicator
Baseline
Follow up
p
-value
Age (years)
27
±
7.5
32
±
7.6
–
Body composition
Height (m)
1.6
±
0.1
–
–
Weight (kg)
86.9
±
19.6 92.8
±
18.9
<
0.001
BMI (kg/m
2
)
33.8
±
7.5
36.4
±
7.7
<
0.001
Fat-free soft-tissue mass (kg)
45.6
±
6.8
46.2
±
6.3
0.234
Fat mass (kg)
36.3
±
10.3 40.9
±
10.6
<
0.001
Body fat (%)
42.3
±
7.8
44.9
±
6.4
<
0.001
Trunk fat mass (% total FM)
43.6
±
5.8
46.2
±
5.3
<
0.001
Leg fat mass (% total FM)
42.6
±
6.3
40.1
±
6.1
<
0.001
Android fat mass (% total FM)
7.7
±
1.6
8.4
±
1.6
<
0.001
Gynoid fat mass (% total FM)
19.3
±
2.7
18.5
±
2.4
<
0.001
VAT (cm
3
)
59 (37–93)
75 (49–110)
0.038
SAT (cm
3
)
508 (324–611) 499 (352–604)
0.013
Socio-demographic variables
Education and employment
Obtained grade 12 (%)
32.8
42.1
0.134
Employed/students (%)
32.8
45.3
0.042
Reproductive health
Hormonal contraceptive use (%)
46.8*
#
34.3
0.201
Parity (
≥
1 child) (%)
57.8*
85.9
0.001
Housing
Housing density (people/room)
1.33
±
0.9
1.38
±
1.19 0.630
Running water inside house (%)
26.5
37.5
<
0.001
Flush toilet inside house (%)
26.5
40.6
0.001
Asset index (%14)
42.1
±
19.4 55.8
±
17.3
<
0.001
Lifestyle variables
Current smoker (%)
12.5
#
15.6
<
0.001
Consume alcohol (%)
37.5
48.4
0.291
Data are represented as either mean
±
standard deviations or medians (inter-
quartile range), Continuous data were compared using Wilcoxon rank test or
dependent
t
-test, frequencies were compared using McNemar chi-squared test,
significance
p
<
0.05.
*Significant difference in age between groups at baseline
#
Significant difference in BMI between groups at baseline.
FM, fat mass; VAT, visceral adipose tissue; SAT, subcutaneous adipose tissue.
Baseline age (years)
15 20 25 30 35 40 45 50
%
Δ
Weight
40
20
0
–20
r
=
–0.35
p
=
0.04
Baseline BMI (kg/m
2
)
20
30
40
50
%
Δ
Weight
40
20
0
–20
r
=
–0.39
p
=
0.001
Fig. 1.
Relationship between baseline age, baseline BMI and relative change in body weight (%).
A
B