


 21 / 82

CARDIOVASCULAR JOURNAL OF AFRICA • Volume 29, No 1, January/February 2018
AFRICA
19
values for TAG of rest CCTA in all coronary arteries were 42.9%
(9/21; 95% CI, 21.9–65.9%), 83.3% (25/30; 95% CI, 65.3–94.3%),
64.3% (9/14; 95% CI, 35.2–87.1%) and 67.6% (25/37; 95% CI,
49.5–82.6%), respectively.
In five (5/51; 9.8%) vessels (one LAD, two LCX and two
RCA), TAG of stress CCTA was not consistent with the findings
of stress perfusion CMR. Because two RCAs were hypoplastic
and one LCX exhibited diffuse atherosclerotic changes that
could not influence the HU gradient, the TAG values of these
coronary arteries met the criteria for functionally significant
stenosis, but no perfusion defects were observed on stress
perfusion CMR. On the other hand, one LCX had stenosis in
the far distal portion of the coronary artery, and one LAD had
stenosis of the coronary ostium. TAG values of these vessels met
the criteria of functionally non-significant stenosis, but CMR
images acquired during stress and at rest showed a complete,
reversible sub-endocardial perfusion defect.
In coronary arteries with moderate stenosis on ICA, the
sensitivity, specificity, PPV and NPV for TAG of stress CCTA
were 93.3% (14/15; 95% CI, 68.0–98.9%), 100% (12/12; 95% CI,
73.4–100%), 100% (14/14; 95%CI, 76.7–100%) and 92.3% (12/13;
95% CI, 63.9–98.7%), respectively. The sensitivity, specificity and
PPV for TAG of coronary arteries with moderate stenosis were
higher than the corresponding values for all vessels on both
stress and rest CCTA (Table 3).
Discussion
Our data show that the TAG of stress CCTA for the detection of
haemodynamically significant coronary artery stenosis yielded
an excellent diagnostic performance, and higher accuracy was
observed in the coronary arteries with moderate stenosis than
for all vessels (Fig. 2). This indicates that TAG could facilitate
decisions regarding which coronary arteries would benefit from
revascularisation in patients with CAD.
It is widely known that anatomical measures of stenosis are
not good predictors of functionally significant stenosis. The
high sensitivity of CCTA has been validated in prospective
multi-centre studies, although specificity is a known limitation
of CCTA.
12
Invasive FFR was shown to reduce the rate of
the composite end-point of death, non-fatal MI and repeat
revascularisation in patients with multi-vessel coronary artery
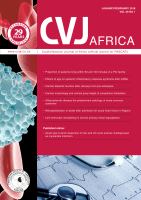
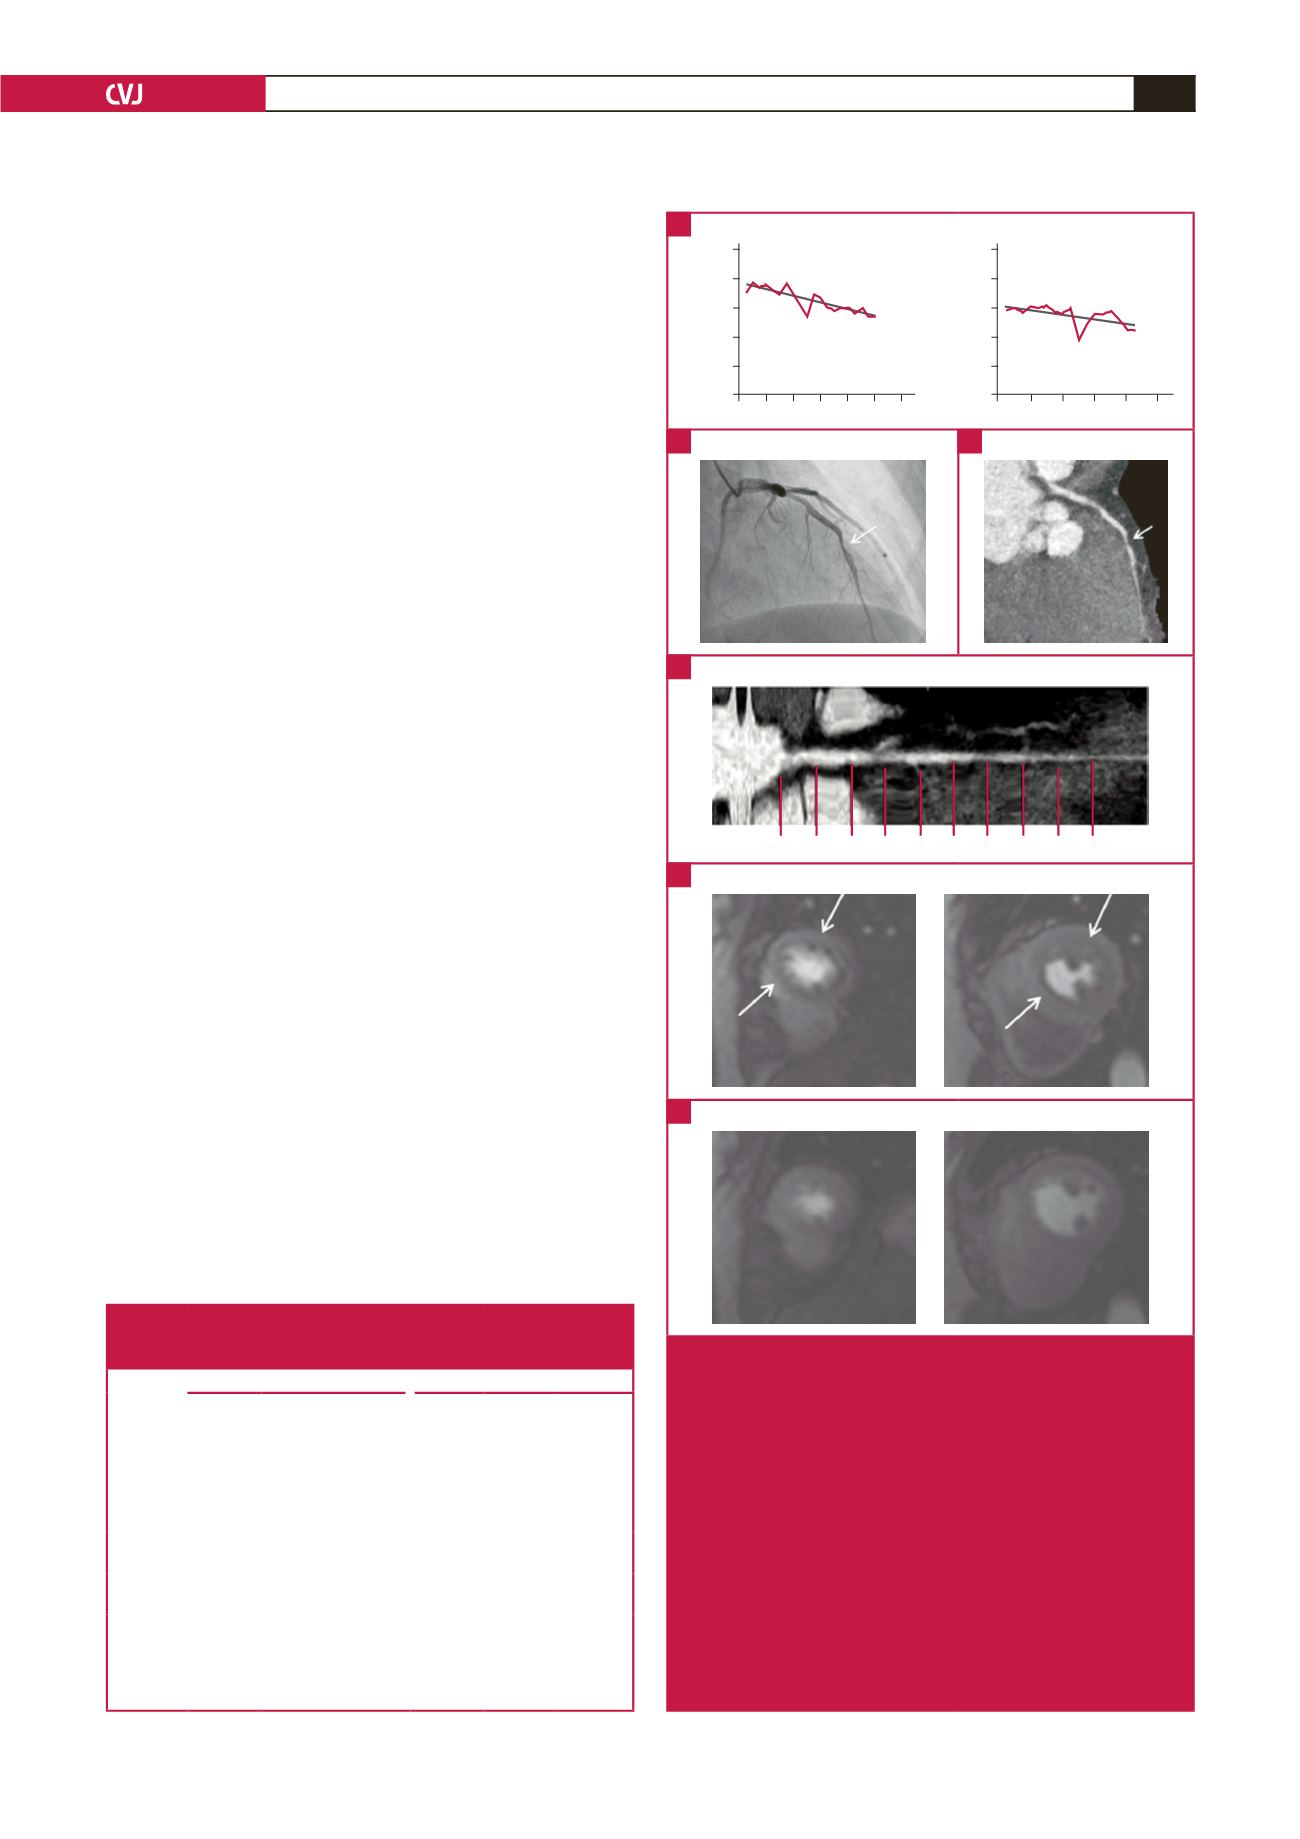
0 2 4 6 8 10 12
1000
800
600
400
200
0
stress
y
= –23.173x + 771.36
0 2 4 6 8 10
1000
800
600
400
200
0
rest
y
= –16.353x + 616.12
708 746 765 618 692 670 580 600 594 498
Fig. 2.
A 47-year-old woman with chest pain. (A) TAG of the LAD
was –23 HU/10 mm on stress CCTA and –16 HU/10 mm
on rest CCTA. (B) Invasive coronary angiography, and
(C) curved multi-planar reformatted images of stress
CCTA show significant stenosis in the mid-LAD. (D)
Axial multi-planar reformatted image shows correspond-
ing luminal attenuation of CCTA. (E) CMR imaging with
stress perfusion imaging shows low signal intensity,
indicating a subendocardial perfusion defect in the ante-
rior septum and anterior wall at the mid-ventricular level
(LAD territory). (F) No low-signal intensity lesion was
visible with rest perfusion imaging. TAG
=
transluminal
attenuation gradient, LAD
=
left anterior descending
artery, CCTA
=
coronary computed tomography angiog-
raphy, CMR
=
cardiac magnetic resonance.
A
B
D
E
F
C
Table 3. Overall sensitivity, specificity, PPV and NPV of TAG of the
coronary arteries with moderate stenosis, all coronary arteries and
per-patient analysis on stress and rest CCTA scans
Stress CCTA
Rest CCTA
Moderate
stenosis
(
n
=
27)
All
vessels
(
n
=
51)
Per
patient
(
n
=
17)
Moderate
stenosis
(
n
=
27)
All
vessels
(
n
=
51)
Per
patient
(
n
=
17)
Sensitivity 93.3
(14/15)
90.5
(19/21)
90
(9/10)
46.7
(7/15)
42.9
(9/21)
66.7
(6/9)
Specificity 100.0
(12/12)
90.0
(27/30)
71.4
(5/7)
83.3
(10/12)
83.3
(25/30)
57.1
(4/7)
PPV
100.0
(14/14)
86.4
(19/22)
81.8
(9/11)
77.8
(7/9)
64.3
(9/14)
66.7
(6/9)
NPV
92.3
(12/13)
93.1
(27/29)
83.3
(5/6)
55.6
(10/18)
67.6
(25/37)
57.1
(4/7)
All data are percentages. The absolute numbers used to calculate the percent-
ages are in parentheses.
PPV
=
positive predictive value, NPV
=
negative predictive value, TAG
=
transluminal attenuation gradient, CCTA
=
coronary computed tomography
angiography.