


 9 / 82

CARDIOVASCULAR JOURNAL OF AFRICA • Volume 29, No 1, January/February 2018
AFRICA
7
To minimise these delays, it has been suggested that 12-lead
ECG and STEMI diagnosis should become standard practice
in the pre-hospital setting. This would allow for patients to be
transported directly to a PCI facility.
4
However, as outcome is
linked to the time to reperfusion, the outcome benefit gained
of initial transport to a PCI facility may be offset by protracted
transport times to such facilities. The geographic distribution
of patients and PCI facilities and their relative proximity will
therefore impact on the feasibility of these recommendations,
and the successful development and implementation of regional
coronary care networks for patients with STEMI.
The aim of this study was to determine the proportion
of South Africans who live within 60 and 120 minutes of a
PCI facility. To this end, we determined the driving times and
distances from each municipal ward to the closest PCI facility.
This can be used as a measure of access and as a guide for future
development of coronary care and referral networks.
Methods
We assessed timely access to PCI facilities by a series of
geospatial analyses. Firstly, we determined the driving times and
distances to the closest (private and/or public) PCI facility of
each of the municipal wards within South Africa. Hereafter, we
determined the proportion of the South African population who
live within 60 and 120 minutes of these facilities, based on the
average driving times. We purposefully selected these time frames
as they are in line with local and international PCI reperfusion
guidelines.
4,10
PCI facility availability data from a previously published
cross-sectional study were utilised.
15
We plotted public and private
PCI facilities in turn, using the physical address of each. From
here we used ArcGIS 10 and ArcGIS Online (Esri, California,
United States) to plot a 60- and 120-minute drive-time polygon
around each of the PCI facilities. ArcGIS calculates the drive-
time polygons around created points (PCI facilities, in this case)
that can be accessed within a specified time of travel from that
point. These drive times are calculated using predicted typical
traffic trends. Typical traffic trends for each road are determined
within ArcGIS by averaging a week’s real-time travel speeds in
five-minute intervals.
Using ArcGIS, a join was created between the current
South African ward boundary lines and the 2011 population
census data.
16
Ward (district)-level data were used as this is the
smallest geographical area available with population data, which
improves accuracy of results. Ward-level data were not available
for the 2016 community survey. The mathematical mid-point
(centroid) of each ward was calculated and the population was
added to this point on the map datasets.
Proximity analysis was used to determine the projected
driving time from each ward centroid to the closest PCI facility
in all provinces. These driving times were again calculated
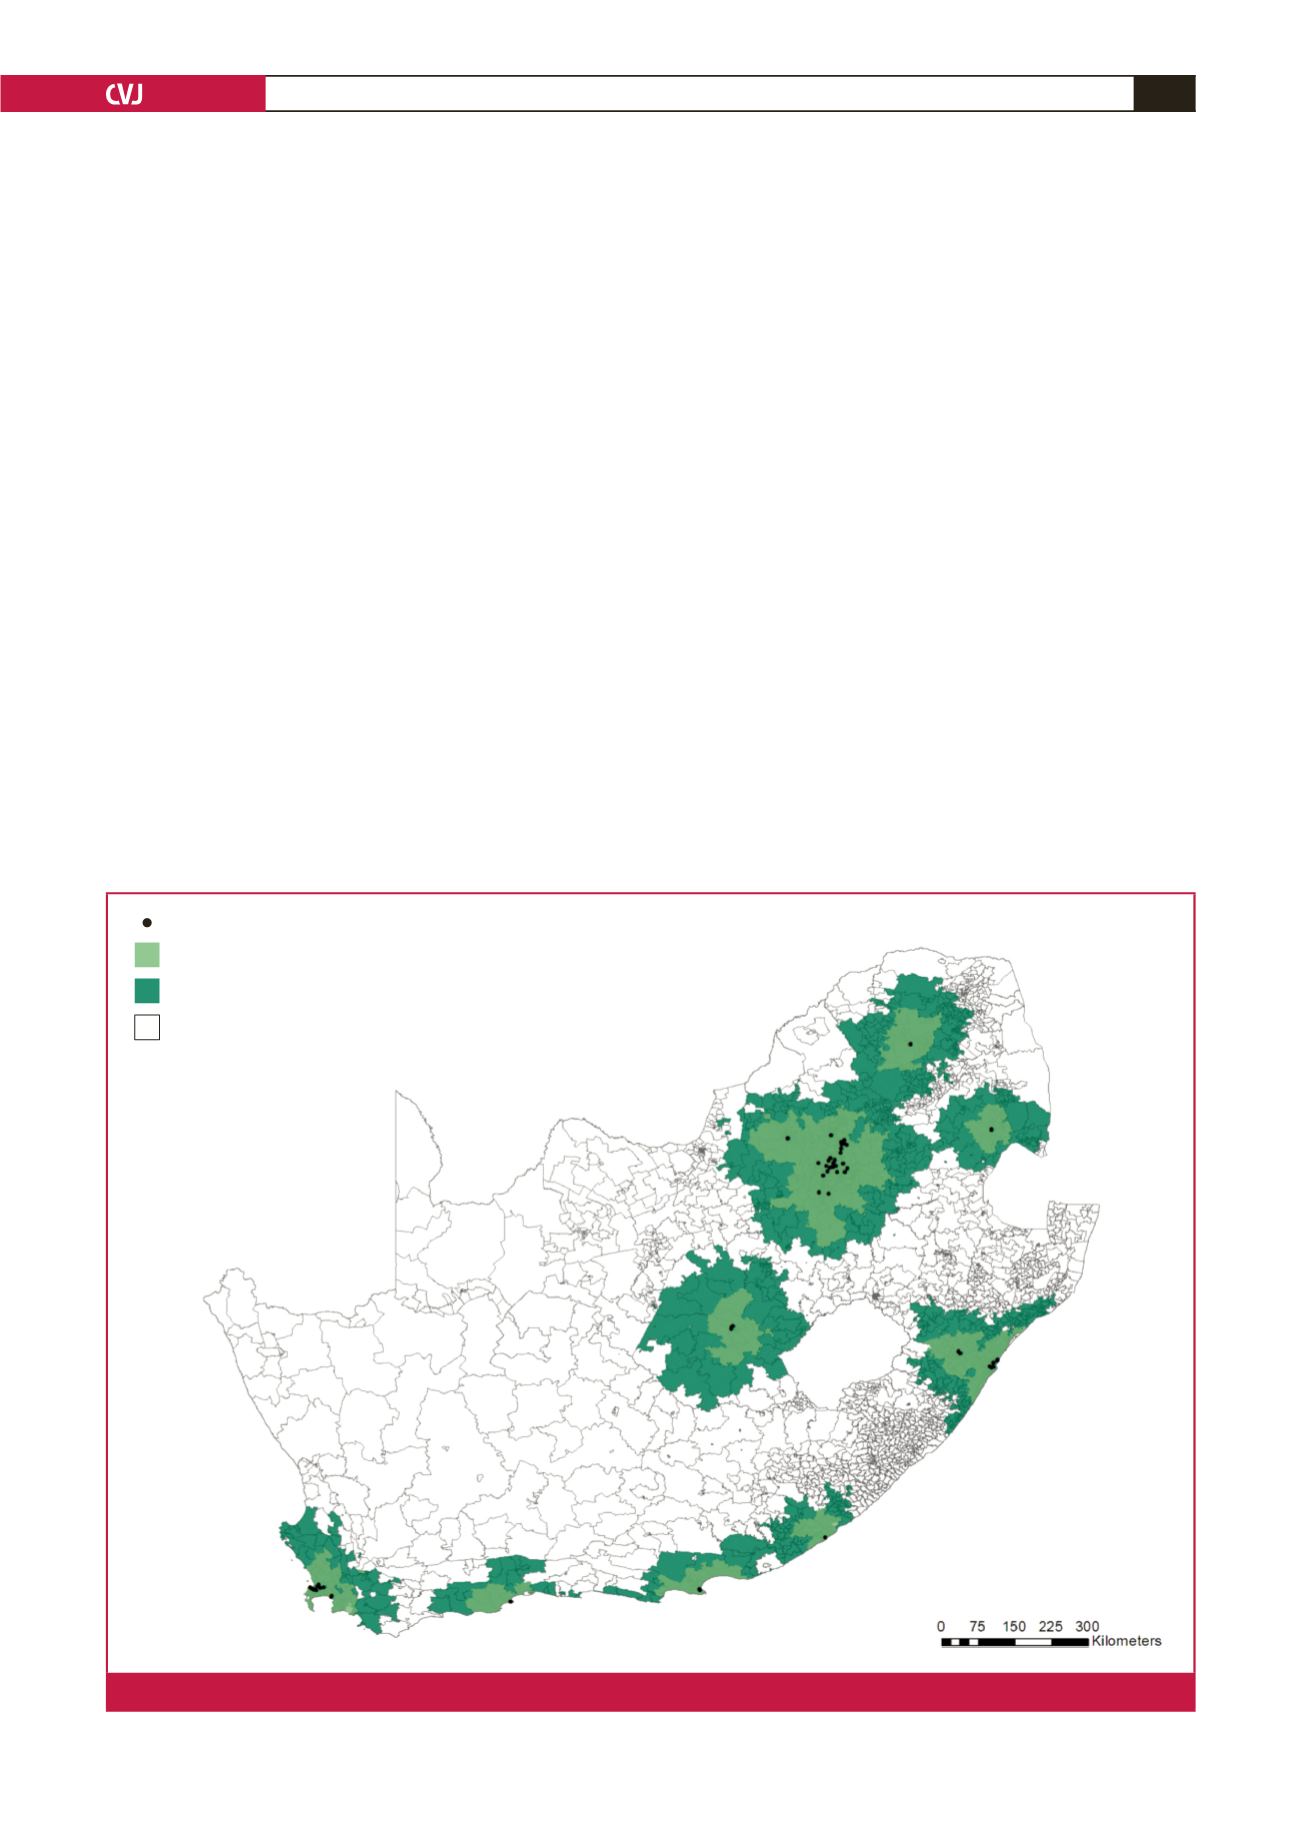
Wards within 60 min of cath lab
Wards within 120 min of cath lab
Wards (2011)
Cath labs
Fig. 1.
Drive-time polygons and wards within 60 and 120 minutes of PCI facilities (ArcGIS 10, Esri, California, United States).