
CARDIOVASCULAR JOURNAL OF AFRICA • Volume 29, No 6, November/December 2018
AFRICA
377
group (1.0 vs 6.0%,
p
<
0.001), which was mainly attributable to
the lower frequency of major bleeding in the TRI group (0.3 vs
3.8%,
p
<
0.001). However, there was no significant difference in
minor bleeding rates between the two groups (0.7 vs 2.1%,
p
=
0.126) (Table 3).
To identify independent predictors of MACE after successful
PCI in this registry, Cox proportional hazard regression analysis
was performed (Table 5). Significant independent predictors
were CKD (HR: 4.172, 95% CI: 1.822–9.551,
p
=
0.021) and
MVD (HR: 2.619, 95% CI: 1.146–4.843,
p
=
0.002). However,
TRI was not an independent predictor of MACE (HR: 1.106,
95% CI: 0.532–1.939,
p
=
0.963).
Subgroup analysis regardingMACEwas performed according
to older age (
≥
65 years), gender, hypertension, diabetes mellitus,
dyslipidaemia, CKD, current smoker, history of IHD, history
of PAD, presence of NSTEMI and MVD. Results in the
various subgroups were similar to those observed in the entire
population (Fig. 3). There were no significant differences in
clinical outcomes between the two groups, and the results
were consistent across all subgroups, without any significant
interactional
p
-value.
Discussion
This study examined the role of vascular access site exclusively,
in patients with NSTE-ACS undergoing PCI from the KOTRI
registry, which is a large, observational cohort to describe the
association between clinical outcomes and bleeding complications
with TRI. The major findings of this analysis are: (1) the TRI
group had a lower rate of MACE and CD than the TFI group
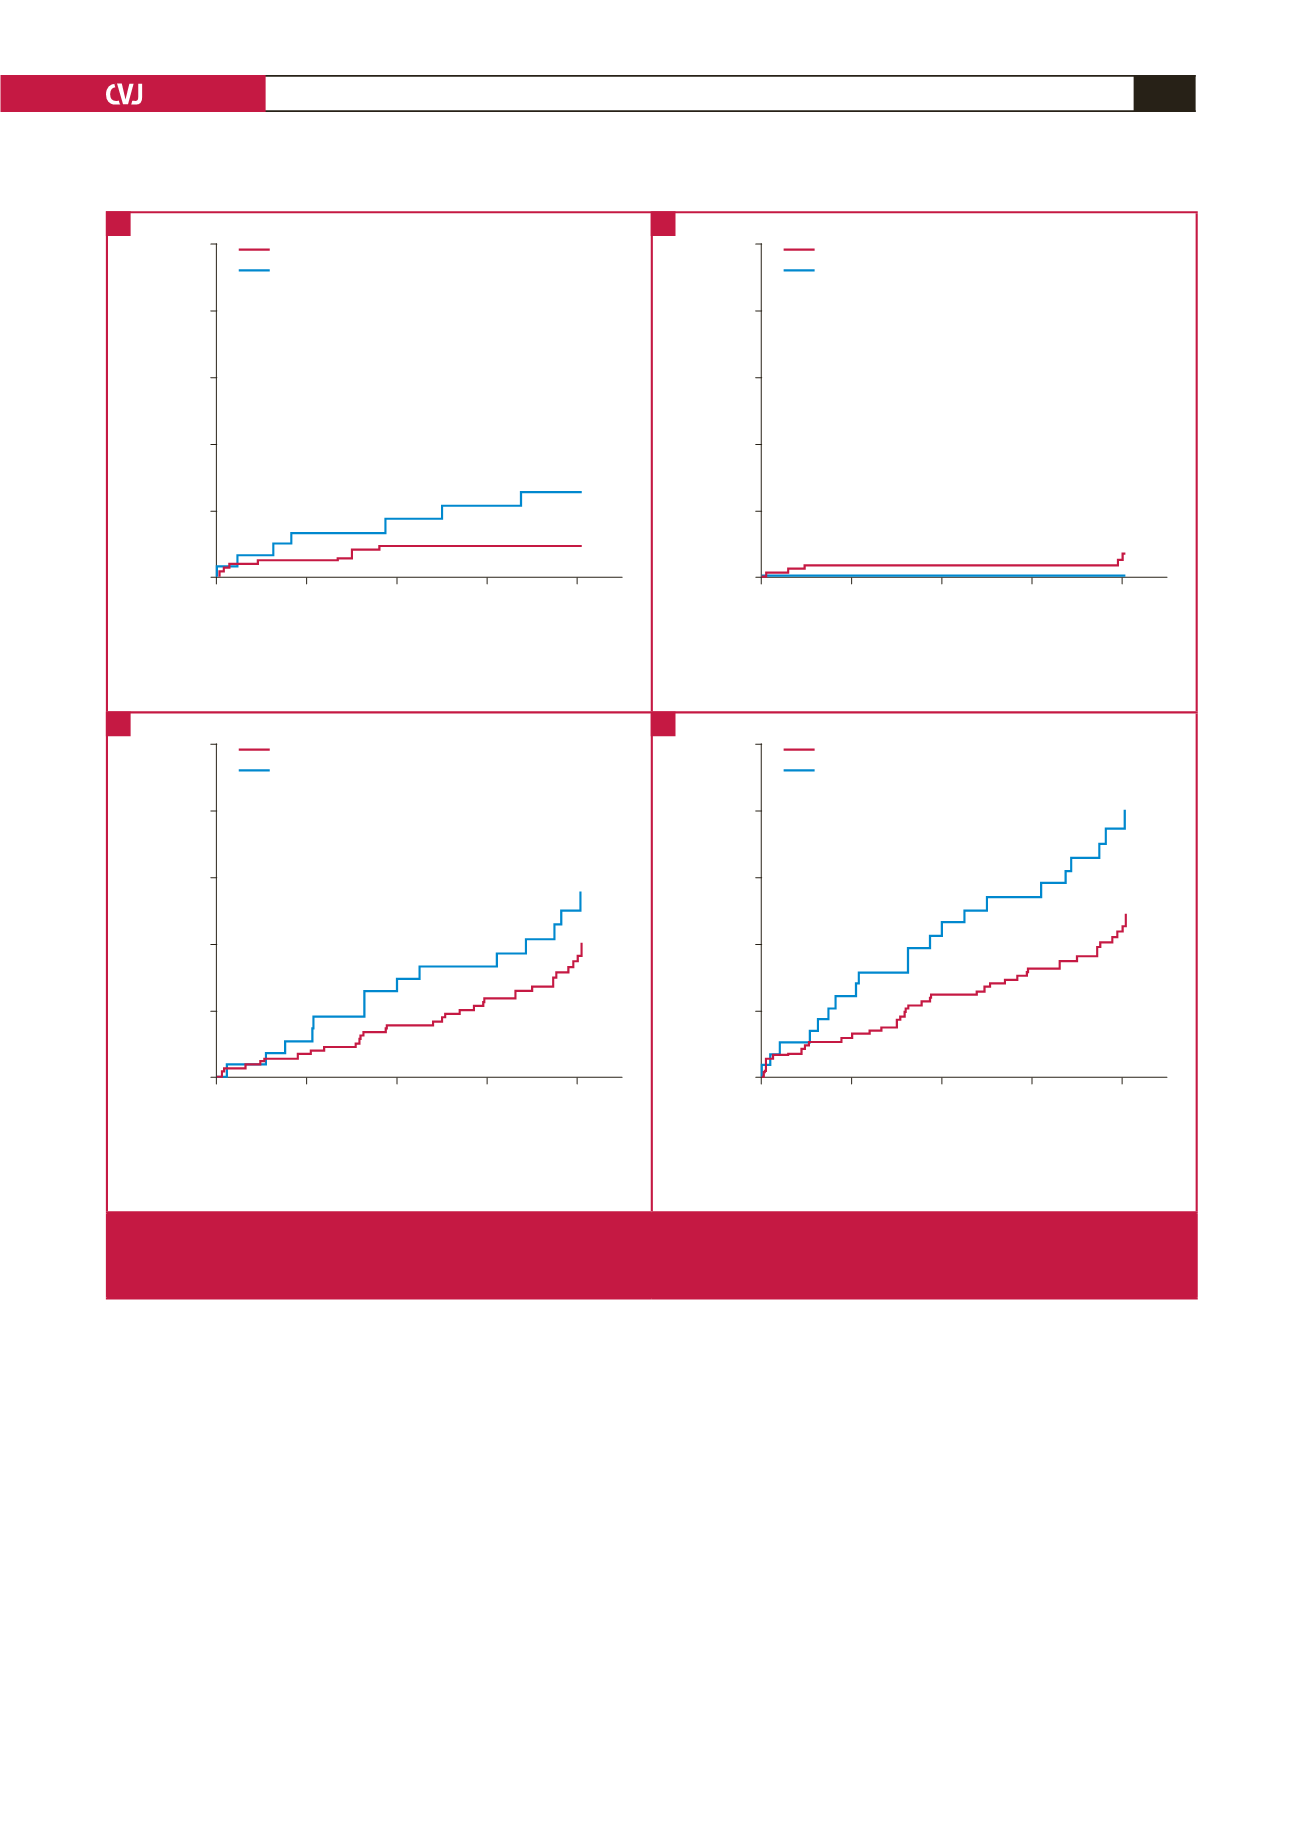
Days
0
90
180
270
360
Cumulative incidence of CD
0.10
0.08
0.06
0.04
0.02
0.00
Log-rank
p
=
0.050
TRI
TFI
No. at Risk
TRI
983
914
889
860
517
TFI
302
278
257
248
179
Days
0
90
180
270
360
Cumulative incidence of MI
0.10
0.08
0.06
0.04
0.02
0.00
Log-rank
p
=
0.207
TRI
TFI
No. at Risk
TRI
983
912
888
858
514
TFI
302
279
258
250
180
Days
0
90
180
270
360
Cumulative incidence of RR
0.10
0.08
0.06
0.04
0.02
0.00
Log-rank
p
=
0.247
TRI
TFI
No. at Risk
TRI
983
910
879
843
498
TFI
302
277
253
245
172
Days
0
90
180
270
360
Cumulative incidence of MACE
0.10
0.08
0.06
0.04
0.02
0.00
Log-rank
p
=
0.045
TRI
TFI
No. at Risk
TRI
983
910
878
843
498
TFI
302
276
252
243
171
Fig. 1.
Kaplan–Meier curves of clinical outcomes at one year in the crude population. A. cardiac death; B. myocardial infarction; C.
repeat revascularisation; D. MACE. TRI
=
transradial intervention; TFI
=
transfemoral intervention; CD
=
cardiac death; MI
=
myocardial infarction; RR = repeat revascularisation; MACE
=
major adverse cardiovascular events.
A
C
B
D


